

A z-score indicates how closely related one given score is to mean of the sample. Extremely high or low z-scores indicates that the given data point is unusually above or below the mean of the sample.

In order to understand z-scores you need to be familiar with distribution. In general, data is distributed in a bell shape curve. With the mean being the exact middle of the graph as shown in the picture below.
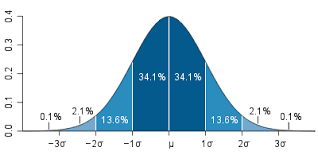
The Greek letter μ is the mean. In this post, we will go through an example that will try to demonstrate how to use and interpret the z-score. Notice that a z-score + 1 takes of 68% of the potential values a z-score + 2 takes of 95%, a z-score + 3 takes of 99%.
Imagine you know the average test score of students on a quiz. The average is 75%. with a standard deviation of 6.4%. Below is the equation for calculating the z-score.

Let’s say that one student scored 52% on the quiz. We can calculate the likelihood for this data point by using the formula above.
(52 – 75) / 6.4 = -3.59
Our value is negative which indicates that the score is below the mean of the sample. Our score is very exceptionally low from the mean. This makes sense given that the mean is 75% and the standard deviation is 6.4%. To get a 52% on the quiz was really bad performance.
We can convert the z-score to a percentage to indicate the probability of getting such a value. To do this you would need to find a z-score conversion table on the internet. A quick glance at the table will show you that the probability of getting a score of 52 on the quiz is less than 1%.
Off course, this is based on the average score of 75% with a standard deviation of 6.4%. A different average and standard deviation would change the probability of getting a 52%.
Standardization
Z-scores are also used to standardize a variable. If you look at our example, the original values were in percentages. By using the z-score formula we converted these numbers into a different value. Specifically, the values of a z-score represent standard deviations from the mean.
In our example, we calculated a z-score of -3.59. In other words, the person who scored 52% on the quiz had a score 3.59 standard deviations below the mean. When attempting to interpret data the z-score is a foundational piece of information that is used extensively in statistics.