In the video below, we will combine the power of SMOTE and logistic regression to develop a model for detecting fraud. SMOTE is used for resampling purposes, while logistic regression is the algorithm we are training.


In the video below, we will combine the power of SMOTE and logistic regression to develop a model for detecting fraud. SMOTE is used for resampling purposes, while logistic regression is the algorithm we are training.

Ensemble methods enable the use of multiple algorithms to make predictions. Instead of only random forest or logistic regression, you can use both, and the results from each model can be used in a “vote” to make predictions. This is one way to combine the strengths of various models to make stronger predictions
Libraries
Below are the libraries that we are using. We are using three different algorithms for our ensemble (random forest, logistic regression, and decision trees). A new function we are using is the VotingClassifer() function, which is used to create our ensemble model. The other functions have been used and explained previously.
from sklearn.linear_model import LogisticRegression
from sklearn.ensemble import VotingClassifier
from sklearn.ensemble import RandomForestClassifier
from sklearn.tree import DecisionTreeClassifier
from sklearn.model_selection import train_test_split
from sklearn.metrics import confusion_matrix, classification_report, roc_auc_score
from sklearn.model_selection import GridSearchCV
import pandas as pd
import numpy as np
df = pd.read_csv("C:/Users/dthom/Documents/python/fraud/chapter_2/chapter_2/creditcard_sampledata_2.csv")
We will now proceed to the data preparation.
Data Prep
The data preparation is simple. We will separate the independent variables from the dependent variables. The X object represents all of the independent variables, while the y object represents our dependent variable, fraud or no fraud. Once everything is separated, we will create our train and test sets using the train_test_split() function. 70% of our data will be used for training, and 30% will be used for testing.
X = df.iloc[:, 1:30]
X = np.array(X).astype('float')
y = df.iloc[:, 30]
y=np.array(y).astype('float')

# Split your data into training and test set
X_train, X_test, y_train, y_test = train_test_split(X, y, test_size=.3, random_state=0)
The next step will involve creating our initial ensemble model.
Model Development
We will use three different classifiers in our ensemble model. The classifiers are logistic regression, random forest, and decision tree. In the code below, each classifier is called, and we also set the various parameters of each classifier to appropriate initial values.
# Define the three classifiers to use in the ensemble
clf1 = LogisticRegression(class_weight={0:1, 1:15},max_iter=1000, random_state=5)
clf2 = RandomForestClassifier(class_weight={0:1, 1:12}, criterion='gini', max_depth=8, max_features='log2',
            min_samples_leaf=10, n_estimators=30, n_jobs=-1, random_state=5)
clf3 = DecisionTreeClassifier(random_state=5, class_weight="balanced")
We will now combine all of our different models into a single model using the VotingClassifier() function. The estimators are given names in quotes, followed by the object after a comma. The “voting” parameter is set to “hard.” Hard voting allows for each model to get one vote per case, with the simple majority winning. For example, if logistic regression and random forest predict fraud simple majority wins this case.
Once we create our combined model, we also fit our data and make predictions. This will allow us to determine the strength of our model.
# Combine the classifiers in the ensemble model
ensemble_model = VotingClassifier(estimators=[('lr', clf1), ('rf', clf2), ('dt', clf3)], voting='hard') #define  voting
ensemble_model.fit(X_train, y_train)
predicted = ensemble_model.predict(X_test) #no probabilities with voting
Next, we will assess the initial results
Model Assessment
In the code below, we use the classification_report() function and confusion_matrix() to see our results.
print(classification_report(y_test, predicted))
print(confusion_matrix(y_test, predicted))

              precision    recall  f1-score   support

         0.0       0.99      1.00      0.99      2099
         1.0       0.89      0.86      0.87        91

    accuracy                           0.99      2190
   macro avg       0.94      0.93      0.93      2190
weighted avg       0.99      0.99      0.99      2190

[[2089   10]
 [  13   78]]
The strength of this model depends on its goals and how it compares to other models. For practice, we will modify the model below.
Model Modification
We will not make any changes to the individual models. Instead, we will make some adjustments to the ensemble model. IN the code below, we are changing the voting to “soft,” which means we are using the probabilities to predict rather than a majority vote. The weights are set so that the second model (random forest) has 4 times the influence compared to the other models. Lastly, the flatten_transform argument is related to the voting argument and changes the output of the data. Below is the code
#Change the weight of the models
# Define the ensemble model
ensemble_model = VotingClassifier(estimators=[('lr', clf1), ('rf', clf2), ('dt', clf3)],
                                 voting='soft',
                                 weights=[1, 4, 1],
                                 flatten_transform=True)
We will now fit our data and predict with it
ensemble_model.fit(X_train, y_train)
predicted = ensemble_model.predict(X_test) #no probabilities with voting
Next, we assess the model
Model Assessment
The model is mostly the same, with a slight improvement in precision. In other words, false positives were reduced.
print(classification_report(y_test, predicted))
print(confusion_matrix(y_test, predicted))

              precision    recall  f1-score   support

         0.0       0.99      1.00      1.00      2099
         1.0       0.94      0.86      0.90        91

    accuracy                           0.99      2190
   macro avg       0.97      0.93      0.95      2190
weighted avg       0.99      0.99      0.99      2190

[[2094    5]
 [  13   78]]
Conclusion
In this post, we saw how models can work together to make stronger, more robust predictions. Ensemble methods are a powerful way to improve fraud detection, and you now know ways to modify the model.
In the video below, we will look at a traditional way to detect fraud using Python. Although this approach is not the most accurate, it is easy to explain and, depending on the context, can provide value.


In this post, we will utilize an algorithm that is slightly more sophisticated than the traditional approach of creating rules. We will use logistic regression to determine whether fraud has occurred or not. The details of how logistic regression works are beyond the scope of this post. However, you can find information on logistic regression here.
Libraries
We will begin by loading our libraries and preparing the data
import pandas as pd
import numpy as np
from sklearn.linear_model import LogisticRegression
from sklearn.model_selection import train_test_split
from sklearn.metrics import confusion_matrix
from sklearn.metrics import classification_report

df = pd.read_csv(df_loc)
Pandas and numpy are for data preparation. The rest of the libraries are self-explanatory. LogisticRegression is for logistic regression. train_test_split is for creating our train and test sets. The last two libraries provide tools for assessing our model. The last line of code loads our data. This data is not available on the internet.
Data Preparation
Below, we take a look at the data.
df.head()
Out[5]:
   Unnamed: 0        V1        V2        V3        V4        V5        V6  \
0      258647  1.725265 -1.337256 -1.012687 -0.361656 -1.431611 -1.098681
1       69263  0.683254 -1.681875  0.533349 -0.326064 -1.455603  0.101832
2       96552  1.067973 -0.656667  1.029738  0.253899 -1.172715  0.073232
3      281898  0.119513  0.729275 -1.678879 -1.551408  3.128914  3.210632
4       86917  1.271253  0.275694  0.159568  1.003096 -0.128535 -0.608730
There are more variables than this. Our goal is to predict fraud using the available variables. In the code below, we will separate the X and y values, which will be crucial when creating our training and testing data.
# Separate X, and y values
X = df.iloc[:, 1:30]
X = np.array(X).astype('float')
y = df.iloc[:, 30]
y=np.array(y).astype('float')
In the code above, we instructed Python to use columns 2 to 29 as the X values and convert them into an array. We then instructed Python to extract column 30 and create a separate array.
Create Train and Test Sets
We will now separate our data into training and test sets. We will train the data on the training set and test it with the other set. Below is the code.
# Create the training and testing sets
X_train, X_test, y_train, y_test = train_test_split(X, y, test_size=.3, random_state=0)

In the code above, we create four objects, which are all to the left of the equal sign. To the right of the equal sign, we have our function train_test_split(). This function is using our X and y objects from the data preparation section and separating them at a ratio of 70/30. In other words, 70% of the X and y values are for training and 30% are for testing. This is why the test_size argument is set to 0.3. Lastly, the random_state argument determines the seed, allowing you to replicate your approach.
Fit the Model
We will now fit our data to the model. We will create an instance of the logistic regression algorithm and call it “model”. The max_iter argument is to make sure the model converges. Next, we use the .fit() method with our training data. Lastly, we make our predictions using the .predict() method with the testing data
# Fit a logistic regression model to our data
model = LogisticRegression(max_iter=1000)
model.fit(X_train, y_train)

# Obtain model predictions
predicted = model.predict(X_test)
Model Accuracy
The model accuracy is below. The results indicate that the model struggles more with false positives (2) compared to false negatives (1). Whether this is a good model or not depends on comparison to other models and the context of the project.
# Print the classifcation report and confusion matrix
print('Classification report:\n', classification_report(y_test,predicted))
conf_mat = confusion_matrix(y_true=y_test, y_pred=predicted)
print('Confusion matrix:\n', conf_mat)

Classification report:
               precision    recall  f1-score   support

         0.0       1.00      1.00      1.00      1503
         1.0       0.91      0.83      0.87        12

    accuracy                           1.00      1515
   macro avg       0.95      0.92      0.93      1515
weighted avg       1.00      1.00      1.00      1515

Confusion matrix:
 [[1502    1]
 [   2   10]]
Conclusion
Logistic regression is one of many great tools for fraud detection. Compared to other approaches, it is still somewhat simple, which is another major benefit of using it.

In this post, we will modify a model when trying to detect fraud. Most, if not all, machine learning algorithms have parameters that can be adjusted. Adjusting these parameters can potentially improve the accuracy of the model. Each algorithm also has different parameters that can be tuned. For our purposes, we will be using the random forest algorithm.
Libraries
Below are the libraries we will use in this post.
from sklearn.ensemble import RandomForestClassifier
from sklearn.model_selection import train_test_split
from sklearn.metrics import confusion_matrix, classification_report, roc_auc_score
import pandas as pd
import numpy as np
import matplotlib.pyplot as plt
The RandomForestClassifier() is the function to create an instance of the random forest algorithm. The train_test_split() function will be used for splitting our data into training and test sets. The confusion_matrix(), classification_report(), and roc_auc_score() functions will be used for assessing our model’s performance. Pandas and numpy are for data preparation. Lastly, matplotlib will be used in conjunction with the roc_auc_score(), which will be explained in detail later.
Data Preparation
Below is the data preparation. In this code, we are separating the independent variables from the dependent variable. Columns 2-29 will be used to predict column 30. Column 30 tells us if the example is fraudulent or not.
X = df.iloc[:, 1:30]
X = np.array(X).astype('float')
y = df.iloc[:, 30]
y=np.array(y).astype('float')
For the X object above, we pull columns 2-29. Then we convert the X object to an array in the next line. We repeat this process for the y object, but we only pull column 30.
In the code below, we are now splitting our X and y objects into training and testing data. The training data teaches the algorithm, and you then assess your model by using the testing data.
# Split your data into training and test set
X_train, X_test, y_train, y_test = train_test_split(X, y, test_size=.3, random_state=0)
We create four objects to the left of the equal sign, two each for the X object and the y object. To the left of the equal sign, we use our train_test_split() function to divide the X and y objects. The argument test_size tells Python what proportion of the data should be used for the test data. For our example, 30% of the data is set aside for testing purposes.
Model Development
In the code below, we are going to create our initial model using random forest.
# Define the model with balanced subsample
model = RandomForestClassifier(class_weight='balanced_subsample', random_state=5)

# Fit your training model to your training set
model.fit(X_train, y_train)
Above, we create an object called “model” that contains an instance of the random forest algorithm. Inside the function, we set the argument class_weights to balanced_subsample. Setting the class weight to balanced is common in fraud detection because there is an imbalance in the classes, as fraud is highly uncommon. By setting the class weights to balance it so that misclassifications of fraud and non-fraud have the same penalty. Remember that by default, 95% percent of our data is not fraudulent without the use of a model. In addition, a balanced subsample is used when each tree is bootstrapped or not, based on the training data.
After addressing imbalances, we then fit our model and calculate the probabilities that each predicted example is correct. These probabilities will be useful in making the orc curve score.
# Obtain the predicted values and probabilities from the model
predicted = model.predict(X_test)
probs = model.predict_proba(X_test)
Next, we will assess the original model
Model Assessment
The code below provides several metrics. The roc_auc_score calculates sensitivity (true positive rate) against its 1-specificity (false positive rate) and ranges in value from 0 to 1. The closer the value is to 1, the better. Other metrics we calculate include metrics related to the classification_report() function (precision, recall, f1-score, and accuracy) and the confiusion_matrix(), which creates a crosstab of the results.
# Print the roc_auc_score, the classification report and confusion matrix
print(roc_auc_score(y_test, probs[:,1]))
print(classification_report(y_test, predicted))
print(confusion_matrix(y_test, predicted))

0.9604599783256286
              precision    recall  f1-score   support

         0.0       0.99      1.00      1.00      2099
         1.0       0.99      0.81      0.89        91

    accuracy                           0.99      2190
   macro avg       0.99      0.91      0.94      2190
weighted avg       0.99      0.99      0.99      2190

[[2098    1]
 [  17   74]]
The ROC curve value is 0.96, which indicates a strong model as the value is close to 1. Precision is much stronger than recall, which means the model is better at avoiding false positives than it is at avoiding false negatives. The F1-score is a composite of precision and recall. Also note that model accuracy is 99%, which is expected when dealing with fraud detection.
Model Adjustment
The initial model looks rather good, but there is always a question as to whether we can improve the model. In the code below, we make the following modifications to our model.
The rest of the code is a repeat of before
# Change the model options
model = RandomForestClassifier(bootstrap=True, class_weight={0:1, 1:12}, criterion='entropy',

			# Change depth of model
            max_depth=10,

			# Change the number of samples in leaf nodes
            min_samples_leaf=10,

			# Change the number of trees to use
            n_estimators=20, n_jobs=-1, random_state=5)

# Fit your training model to your training set
model.fit(X_train, y_train)

# Obtain the predicted values and probabilities from the model
predicted = model.predict(X_test)
probs = model.predict_proba(X_test)
We will now assess this model
2nd Assessment
Below is the code for the second assessment of the model. This code is the same as before.
# Print the roc_auc_score, the classification report and confusion matrix
print(roc_auc_score(y_test, probs[:,1]))
print(classification_report(y_test, predicted))
print(confusion_matrix(y_test, predicted))

0.9575150909119465
              precision    recall  f1-score   support

         0.0       0.99      1.00      1.00      2099
         1.0       0.94      0.84      0.88        91

    accuracy                           0.99      2190
   macro avg       0.97      0.92      0.94      2190
weighted avg       0.99      0.99      0.99      2190

[[2094    5]
 [  15   76]]
The model lacks improvement. We were able to decrease the number of false negatives by increasing the number of false positives. Whether this is better depends on the context and deciding if false negatives or false positives are more detrimental.
Conclusion
What we learned here is how to not only create a model and assess it, but also how to make modifications to the model in hopes of improving it. The power of machine learning can help you improve models to have more success in detecting fraud.
Fraud detection is a critical tool used in a variety of industries. The video shares basic tips for examining the data and how to deal with data imbalances.


In this post, we are using logistic regression and the sampling technique of SMOTE to improve our model’s ability to detect fraud. SMOTE creates synthetic cases of actual fraud in order to balance out the number of true and false cases in the dataset. We will begin by loading our libraries
Libraries
The libraries we are using are below. As we use these libraries, they will be explained.
from imblearn.pipeline import Pipeline
from imblearn.over_sampling import SMOTE
import pandas as pd
import numpy as np
import matplotlib.pyplot as plt
from sklearn.linear_model import LogisticRegression
from sklearn.model_selection import train_test_split
from sklearn.metrics import confusion_matrix
from sklearn.metrics import classification_report
Data Preparation
We load our data using the .read_csv() method from pandas. The object data_loc was created to store the location of the data on the computer. The data used in this example is not available. After loading the data, we use .shape to see how many columns and rows of data we have. The code and output are below
df = pd.read_csv(data_loc)
df.shape
(5050, 31)
You can see that we have 5050 rows of data and 31 columns of data. Next, we need to separate the X values from the y value. To do this, we will take columns 2 to 29 as X values and column 30 as the y value. The code below completes all of this for us.
X = df.iloc[:, 1:30]
X = np.array(X).astype('float')
y = df.iloc[:, 30]
y=np.array(y).astype('float')
In the code below, we are creating our train and test sets. We are going to split our X and y objects so that 70% of the data is for training and 30% of the data is for testing purposes. The function train_test_split() is used for this, with the argument test_size being set to 0.3 for 30% test data and the random_state being set to 0, which is the seed number.
# Split your data X and y, into a training and a test set and fit the pipeline onto the training data
X_train, X_test, y_train, y_test = train_test_split(X, y, test_size=.3, random_state=0)
Pipeline Development

A pipeline is used to chain several actions together sequentially and is similar to piping in R. To do this, we are using the Pipeline() function from the imblearn library. The imblearn library is used to address imbalances in datasets, as our data has. We will complete the pipeline by first creating an instance of SMOTE and logistic regression. We do this because these are the two objects we will pipe one after the other.
Next, we will actually create our pipe. We created an object called “pipeline” and used the Pipeline function. Inside this function are two tuples. The first is for SMOTE and uses the first object we create at the beginning of this cell, and the second contains the information of the object we created. Also, notice how both tuples are wrapped inside square brackets. The code for all of this is below
# Define which resampling method and which ML model to use in the pipeline
resampling = SMOTE()
model = LogisticRegression(max_iter=1000)

# Define the pipeline, tell it to combine SMOTE with the Logistic Regression model
pipeline = Pipeline([('SMOTE', resampling), ('Logistic Regression',model)])
What we did in this code was tell Python to use SMOTE to create synthetic cases of instances of fraud. Once the resampling is completed, the resampled data will be used to train the model.
Model Development and Performance Metrics
We will now train our model with the SMOTE data using logistic regression and make the predictions. We use the .fit() method with the pipeline object and then use the .predict() method with the test data. The code is below
# Fit your pipeline onto your training set and obtain predictions by fitting the model onto the test data
pipeline.fit(X_train, y_train)
predicted = pipeline.predict(X_test)
Now we run our performance metrics to see how our model did. We will use the classification_report() and confusion_matrix() functions. The classification_report function tells us the precision, recall, and f1-score. The confusion_metrix() function is a printout of a crosstab of our data. Notice in both of these metrics, we are using the y test values compared to the predicted values.
# Obtain the results from the classification report and confusion matrix
print('Classifcation report:\n', classification_report(y_test, predicted))
conf_mat = confusion_matrix(y_true=y_test, y_pred=predicted)
print('Confusion matrix:\n', conf_mat)
Classifcation report:
precision recall f1-score support
0.0 1.00 1.00 1.00 1505
1.0 0.82 0.90 0.86 10
accuracy 1.00 1515
macro avg 0.91 0.95 0.93 1515
weighted avg 1.00 1.00 1.00 1515
Confusion matrix:
[[1503 2]
[ 1 9]]Conclusion
With the help of SMOTE, it is possible to improve the performance of your algorithm when detecting fraud. As such, SMOTE is a powerful tool that can be useful in the appropriate context.

Fraud detection today leverages complex algorithms and machine learning approaches. However, this was not always the case. In the past, fraud detection used simple yet highly efficient methods. In this post, we will look at a traditional method of fraud detection that involves setting threshold values for variables to flag a case a fraud or not.
Load Libraries
We will begin by loading our libraries and data. The data for this demonstration is not available on the web. Below, we load pandas, numpy, and matplotlib.
import pandas as pd
import numpy as np
import matplotlib.pyplot as plt
df = pd.read_csv(data_loc)
We will now look at the means of the individual variables.
Examine Means
To determine the cutoff values for setting our thresholds, we need to examine the means of each variable when a case is marked as fraud or not. Next, we will look at boxplots of the variables we will use. Below is the code and output for the means of the variable based on class.
df.groupby('Class').mean() #provides a general threshold for fraud
Out[2]:
        Unnamed: 0        V1        V2        V3        V4        V5  \
Class
0      143084.8702  0.035030  0.011553  0.037444 -0.045760 -0.013825
1      121384.7000 -4.985211  3.321539 -7.293909  4.827952 -3.326587

             V6        V7        V8        V9       V10       V11       V12  \
Class
0     -0.030885  0.014315 -0.022432 -0.002227  0.001667 -0.004511  0.017434
1     -1.591882 -5.776541  1.395058 -2.537728 -5.917934  4.020563 -7.032865

            V13       V14       V15       V16       V17       V18       V19  \
Class
0      0.004204  0.006542 -0.026640  0.001190  0.004481 -0.010892 -0.016554
1     -0.104179 -7.100399 -0.120265 -4.658854 -7.589219 -2.650436  0.894255

            V20       V21       V22       V23       V24       V25       V26  \
Class
0     -0.002896 -0.010583 -0.010206 -0.003305 -0.000918 -0.002613 -0.004651
1      0.194580  0.703182  0.069065 -0.088374 -0.029425 -0.073336 -0.023377

            V27       V28      Amount
Class
0     -0.009584  0.002414   85.843714
1      0.380072  0.009304  113.469000
Now, there are many different ways to explore the data to determine which variables to select and what to set the threshold values to. We can look at histograms, descriptive statistics, rely on domain knowledge, etc. For the sake of simplicity, we are selecting variables V1 and V3 for additional analysis. You can have more than two variables if you desire. Below are boxplots of V1 and V3.
#data to plot
V1=df[df['Class'] == 1]['V1']
V3=df[df['Class'] == 1]['V3']
plot_data=[V1,V3]
# Create a basic box plot
plt.boxplot(plot_data,tick_labels=["V1","V3"] )
plt.show()
Here is an explanation of the code.

We create two objects called V1 and V3. Both of these objects subset the data for Class when it equals 1 (which indicates fraud). The V1 object pulls the values of V1 when Class equals 1. The V3 does the same for the V3 variable. In other words, we now have all values of V1 and V3 when fraud is indicated. Next, we store our values in another object called plot_data. We then create our boxplot and label the x-axis.
The box plot for V1 indicates a median value of around -3, while the box plot for V3 indicates a median value of around -5. We will use these values as our thresholds.
Confusion Matrix with Thresholds
We will now set our thresholds and create the confusion matrix. Below is the code and output.
df['flag_as_fraud'] = np.where(np.logical_and(df['V1']<-3, df['V3']<-5), 1, 0)

print(pd.crosstab(df.Class, df.flag_as_fraud, rownames=['Actual Fraud'], colnames=['Flagged Fraud']))
Flagged Fraud     0   1
Actual Fraud
0              4984  16
1                28  22
Here is an explanation of the code.
1. We create a new column called “flag_as_fraud”. This column uses a 1 when V1 < -3 and V3 < -5. All other instances are flagged as 0.
2. Next, we create our crosstabs comparing Class with flag_as_fraud. Here are the results.
4984 True negatives = It was flagged as not being fraud, and was not actual fraud
22 True positives = It was flagged as fraud, and it was actual fraud
28 False negatives = It was not flagged as fraud, but it was actual fraud
22 False positives = It was flagged as fraud, but it was not actual fraud
Now, whether these results are good or bad depends on the situation. There are problems with false negatives and false positives. Correcting for one means losing accuracy for another. If the context were credit card fraud, false negatives may be worse, as the criminal may get away with fraud. Another way to assess the values is through a classification report.
from sklearn.metrics import confusion_matrix
from sklearn.metrics import classification_report

print('Classification report:\n', classification_report(df['Class'],df['flag_as_fraud']))
conf_mat = confusion_matrix(y_true=df['Class'], y_pred=df['flag_as_fraud'])
print('Confusion matrix:\n', conf_mat)

Classification report:
               precision    recall  f1-score   support

           0       0.99      1.00      1.00      5000
           1       0.58      0.44      0.50        50

    accuracy                           0.99      5050
   macro avg       0.79      0.72      0.75      5050
weighted avg       0.99      0.99      0.99      5050

Confusion matrix:
 [[4984   16]
 [  28   22]]
The output above provides numbers for us to assess. The precision indicates how well our model is at predicting true positives compared to all positives. Recall indicates how well our model predicts true positives compared to all true positives. The F1-score is an aggregate of the precision and recall values. Our model struggles with both precision and recall, so we need to modify this.
Multiple Rules
It is possible to have more than one rule. Below is an example.
df['flag_as_fraud'] = np.where(np.logical_and(df['V1']<-3, df['V3']<-5),1, 0)
df['flag_as_fraud'] = np.where(np.logical_and(df['flag_as_fraud']== 1, df['V7']<-6),1, 0)
df['flag_as_fraud'] = np.where(np.logical_and(df['flag_as_fraud']== 1, df['V9']<-0),1, 0)
df['flag_as_fraud'] = np.where(np.logical_and(df['flag_as_fraud']== 1, df['V10']<-4.5),1, 0)
In this code, we set the initial rule as done previously. Then, for the second rule, we use the previous rule and place the new variable as the second comparison. We then repeat this as many times as necessary. Below is a verbal explanation of the code above
Create “flag_as_fraud” where V1 < -3 and V3 < -5. Then create “flag_as_fraud” where “flag_as_fraud” = 1 and V7 < -6. Then create “flag_as_fraud” where “flag_as_fraud” = 1 and V9 < 0. Then create “flag_as_fraud” where “flag_as_fraud” = 1 and V10 < -4.5.
Below is the classification report and confusion matrix.
print('Classification report:\n', classification_report(df['Class'],df['flag_as_fraud']))
conf_mat = confusion_matrix(y_true=df['Class'], y_pred=df['flag_as_fraud'])
print('Confusion matrix:\n', conf_mat)

Classification report:
               precision    recall  f1-score   support

           0       0.99      1.00      1.00      5000
           1       0.94      0.34      0.50        50

    accuracy                           0.99      5050
   macro avg       0.97      0.67      0.75      5050
weighted avg       0.99      0.99      0.99      5050

Confusion matrix:
 [[4999    1]
 [  33   17]]
Our precision is improved, which means we did excellent work reducing the number of false positives. However, our false negatives have increased, and our recall has decreased.
Conclusion
The traditional approach is excellent in many circumstances. This approach is easy to understand, which can relieve the anxiety ofleaders who need to know what is going on in case there is a problem. Complex algorithms may yield better results, but it is not always clear how they work and what they are doing. With the traditional approach, this is not a problem. However, if high accuracy is needed, sometimes the traditional approach falls short. Which approach to use depends on the context and the needs of the stakeholders.
The video below explains how to create a simple scatterplot using Power BI.


In this post, we will explore how to approach resampling when implementing fraud detection with Python. When examining fraud detection, a significant imbalance often exists between negative and positive fraud cases. The problem with this is that by guessing randomly, your model can be highly accurate in predicting whether a case is fraudulent or not. Therefore, we must consider how to address the low number of positive instances when conducting a fraud analysis.
We are going to first look at the characteristics of the data as is, then we will use Python to balance our data and compare the original data with the modified data.
Data Preparation of Original Data
Below are the libraries we will use.
import pandas as pd
import numpy as np
import matplotlib.pyplot as plt
from imblearn.over_sampling import SMOTE
Pandas and numpy are for creating our dataset. Matplotlib is for data visualization, and the SMOTE function will be used to rebalance our data later on.
The data we will use is not available on the web. Therefore, the code for this dataset is unclear, as I will hide the string where the data comes from on my computer. The code is below.
df = pd.read_csv(data_loc)We will now look at the data using the .info() method
print(df.info())
<class 'pandas.core.frame.DataFrame'>
RangeIndex: 5050 entries, 0 to 5049
Data columns (total 31 columns):
 #   Column      Non-Null Count  Dtype
---  ------      --------------  -----
 0   Unnamed: 0  5050 non-null   int64
 1   V1          5050 non-null   float64
 2   V2          5050 non-null   float64
 3   V3          5050 non-null   float64
 4   V4          5050 non-null   float64
 5   V5          5050 non-null   float64
 6   V6          5050 non-null   float64
 7   V7          5050 non-null   float64
 8   V8          5050 non-null   float64
 9   V9          5050 non-null   float64
 10  V10         5050 non-null   float64
 11  V11         5050 non-null   float64
 12  V12         5050 non-null   float64
 13  V13         5050 non-null   float64
 14  V14         5050 non-null   float64
 15  V15         5050 non-null   float64
 16  V16         5050 non-null   float64
 17  V17         5050 non-null   float64
 18  V18         5050 non-null   float64
 19  V19         5050 non-null   float64
 20  V20         5050 non-null   float64
 21  V21         5050 non-null   float64
 22  V22         5050 non-null   float64
 23  V23         5050 non-null   float64
 24  V24         5050 non-null   float64
 25  V25         5050 non-null   float64
 26  V26         5050 non-null   float64
 27  V27         5050 non-null   float64
 28  V28         5050 non-null   float64
 29  Amount      5050 non-null   float64
 30  Class       5050 non-null   int64
dtypes: float64(29), int64(2)
memory usage: 1.2 MB
None
For our purposes, there are 30 variables available from V1 to Class. We will now look at a breakdown of the Class variable, which tells us if there is fraud or not.
fraud_breakdown = df['Class'].value_counts()
print(fraud_breakdown)
Class
0    5000
1      50
Name: count, dtype: int64
By subsetting for the Class variable and using the .valuecounts() method, we can see that the results indicate there are 5050 rows of data, with 5000 not being fraud and 50 being fraud. This indicates that less than one percent of the cases are instances of fraud, and this is confirmed with the code below.
print(fraud_breakdown / len(df))
Class
0    0.990099
1    0.009901
Name: count, dtype: float64
Next, we will create a visualization of our data.
Data Visualization
In order to create the data visualization, we need to separate the X values, which are all the variables we are using that do not tell us if the case is fraud or not, from the y value, which is the Class variable. We also need to convert them to a numpy array. Below is the code to do this.
X = df.iloc[:, 1:30]
X = np.array(X).astype('float')
y = df.iloc[:, 30]
y=np.array(y).astype('float')
Below is the code for the data scatterplot. The plot will be based on the first two variables of the dataset and colored by the Class variable.
plt.scatter(X[y == 0, 0], X[y == 0, 1],
            label="Class #0", alpha=0.5, linewidth=0.15)
plt.scatter(X[y == 1, 0], X[y == 1, 1],
            label="Class #1", alpha=0.5, linewidth=0.15, c='r')
plt.legend()
plt.show()
Here is a breakdown of the code.
1. We use plt.scatter. Inside, we indicate that for the values in X when y = 0 take the values of the first column. In the second subset, we indicate that in X, when y = 0 take the second column of values.
2. Next, we set the label, alpha, and linewidth.
3. We repeat this process, but this time we take the values when y = 1 instead of y= 0. We also set the color to red instead of the default blue.
4. Finally, we plot both scatter plots on the same plot with a legend indicating what the color means.
You can see the huge imbalance with just this visual. We will now look at how to correct this imbalance.
SMOTE
Resampling can be performed in several ways. Undersampling involves reducing the amount of data you are using to match the number of fraud cases. In other words, for our 5050 dataset with 50 fraud cases, we would reduce this to perhaps 100 rows of data with 50 fraud cases. One problem with this is that you throw out a lot of data.
Another approach is oversampling, which involves duplicating your fraud cases until they match half of your data. For example, since our dataset contains 5050 cases with 50 cases of fraud, we would duplicate our fraud cases until we had 5000 fraud cases for a total dataset size of 10,000. Here you can see the problem of duplicating so much data, which can cause problems.
SMOTE, or synthetic minority oversampling technique, is a variation on oversampling. It involves creating additional fraud cases by generating new cases through the traits of the nearest neighbors. This works if your fraud cases are similar to each other.
Below, we will generate a dataset using SMOTE
# Define the resampling method
method = SMOTE()

# Create the resampled feature set
X_resampled, y_resampled = method.fit_resample(X, y)

print(pd.Series(y).value_counts())
print(pd.Series(y_resampled).value_counts())
print(X.shape[0])
print(X_resampled.shape[0])

0.0    5000
1.0      50
Name: count, dtype: int64
0.0    5000
1.0    5000
Name: count, dtype: int64
5050
10000
The code involves creating an instance of SMOTE(). We then create our resampled X and y values using .fit_resample. Next, we print our results. The first output shows the original shape of the data y values from 5000 to 50 cases of fraud. The next output shows the resampled y values with 5000 to 5000 cases using SMOTE(). Now the data is balanced. The last two outputs show the original shape of the X values and compare it to the new shape, thanks to resampling.
Below is the code for the visualization. It is the same as the previous visual, just with the resampled data.
# Plot the resampled data
plt.scatter(X_resampled[y_resampled == 0, 0],
            X_resampled[y_resampled == 0, 1],
            label="Class #0", alpha=0.5, linewidth=0.15)
plt.scatter(X_resampled[y_resampled == 1, 0],
            X_resampled[y_resampled == 1, 1],
            label="Class #1", alpha=0.5, linewidth=0.15, c='r')
plt.legend()
plt.show()

You can see the difference compared to the first plot. This data is much more balanced, which will help in the detection of fraud cases. How you address imbalances depends on the situation, so let’s not assume SMOTE is the best approach every single time.
Conclusion
Fraud detection is critical in different industries to prevent crime and abuse. Python can be used to support this process. Naturally, fraud is unusual when compared to legitimate transactions. This necessitates the use of various techniques to balance the data and ensure the accuracy of the model.
In the video below, we look at how to modify data tables in R.


In this post, we will look at another religious group that had Communist leanings before Communism was fully articulated. This group is familiar to man and is called the Anabaptist.
There are various sects within the Anabaptist movement. The voluntary sect is the one with which many are familiar today, and this sect includes the Amish and the Mennonites. The voluntary sect, as its name implies, supports people in making their own choices about religion.
The sect of this post is the Theocratic sect. The Theocratic sect believed in seeing power from the state and forcing people to become Anabaptists. Since they had a utopian focus, the Theocratics also were focused on compelling the world to uphold specific views of what heaven on earth would look like. The view they had in mind was of a communal society style, where everything was shared.
Theocratics
The Theocratic sect was originally led by a man named Thomas Muntzer. Muntzer was a disciple of Martin Luther but would later become a convert to Taborism. The Taborites believed in destroying the non-elect and taking their property for the religio-state. Muntzer was convinced he was a prophet and called on the German princes to kill the godless. When he is ignored, Muntzer tries to lead this slaughter himself, and he is executed.

Eventually, the leadership of the Theocratic sect of the Anabaptists falls to Jan Mathys. As the leader, Mathys takes the Theocratics to Munster, Germany. While trapped inside this city, Mathys is convinced that the rest of the world is doomed. Therefore, all property of non-Anabaptists inside the town of Munster was seized, and the non-believers were killed or expelled from the city.
Once the means of production and wealth were taken, Mathys began to implement the policies of his religious utopia. Money is outlawed, which forces everyone to be dependent on the government. Food was taken from homes and rationed (shared) with people being forced to eat in communal halls. It was also illegal to lock or even close your doors since everyone was family.
Siege of Munster
While all this was going on, Munster was under siege by the German princes, who did not appreciate Protestant sectarians seizing a town. During this siege, Mathys, is killed, and a man named Bockelson takes over. Bockelson’s adds to the oppression by implementing polygamy. The women initially rebelled against this, but after many were executed, they quickly got used to the idea.
However, the ladies did not give up without a fight. Since the women could not stop themselves from being married off to someone, they could give their new husbands hell. When the men began to suffer from the relentless behavior of their wives, divorce was allowed. Marriage was essentially abolished, but people being people still found ways to enjoy the rapturous experience of marriage outside the boundaries of marriage. Therefore, in a matter of a few months, the Theocrats have gone from puritans to fornicators with a destruction of the family.
Bockelson would eventually proclaim himself king. However, his reign was short-lived, and the German princes broke into the city, and Bockelsno was killed.
Conclusion
The Theocratics were inspired to bring about the Millennium on earth through the use of force and the implementation of various ideas linked to Communism in the future. They seized all property, money, and controlled the means of production. The Theocritics were also against the family by removing marriage and allowing promiscuity. In addition, as things began to fall, a tyrant arose to control the people. This suggests that paradise is never truly reached. Still, people will often use the promise of a utopia to seize power for themselves, even if it was not their original intention.
Data visualization plays an important part in explaining an analysis. In this post, we will examine how to make bar graphs using Power BI.

In this post, we will look at how you can modify data tables in R. Specifically, we will look at how to add columns, fix errors, and calculate values. Below is the initial code to prepare the data we will use.
library(data.table)
mtcars<-data.table(mtcars)
In the code above, we load the data.table package. We then convert the “mtcars” dataset to be a data.table in the second line. Below is a look at all the columns and the first few rows of data
head(mtcars)
     mpg   cyl  disp    hp  drat    wt  qsec    vs    am  gear  carb
   <num> <num> <num> <num> <num> <num> <num> <num> <num> <num> <num>
1:  21.0     6   160   110  3.90 2.620 16.46     0     1     4     4
2:  21.0     6   160   110  3.90 2.875 17.02     0     1     4     4
3:  22.8     4   108    93  3.85 2.320 18.61     1     1     4     1
4:  21.4     6   258   110  3.08 3.215 19.44     1     0     3     1
5:  18.7     8   360   175  3.15 3.440 17.02     0     0     3     2
6:  18.1     6   225   105  2.76 3.460 20.22     1     0     3     1
Adding a New Column
Adding a new column involves a simple process. In the code below, we call “mtcars” and inside the brackets, we place a comma first. This tells R that we want all rows of data.
After the comma, we create a name for our new column called “distance_travel.” After this, we place the := notation to indicate that we are calculating a value. After the :=, we write mpg * 4. This means multiply the mpg column by 4.
# Add a new column, travel distance
mtcars[, distance_travel := mpg*4]
Below is the output for the code above. To save space, we will not print every column. Instead, we will subset what we want as shown below.
mtcars[1:3,c(1,10:12)]
     mpg  gear  carb distance_travel
   <num> <num> <num>           <num>
1:  21.0     4     4            84.0
2:  21.0     4     4            84.0
3:  22.8     4     1            91.2
You can see the calculated value in the fourth column. This value is mpg multiplied by 4.
Fixing Errors
We can also fix errors for this example. Let’s assume that any value less than 21.5 in the mpg column is a mistake. We can replace those values with NA with the code below.
#fix errors change mpg less than 21.5 to NA
mtcars[mpg <21.5, mpg := NA]
In this code, you can see that we use brackets again and indicate that we are looking for all mpg values that are less than 21.5. These values will be rewritten with NA. Below is the output for select columns and rows only.
mtcars[1:3,1:3]
     mpg   cyl  disp
   <num> <num> <num>
1:    NA     6   160
2:    NA     6   160
3:  22.8     4   108
The NAs are where there used to be mpg values less than 21.5
Adding Columns for Groups
Another value we may want to calculate is to count values by groups. In the code below, we count the number of cars that have an automatic or manual transmission. To do this, we use brackets again. Inside the brackets, we place a comma. After the comma, we name our new variable “total_am” followed by the := notation. After the := notation, we place .N. The .N notation tells are to count all rows. In this case, we are counting all rows by the variable “am,” which stands for automatic transmission, and yes or no. Below is the code and output
# Add a new column equal to total cars with automatic transmission
 mtcars[, total_am := .N, by = am]
mtcars[1:5,c(1,9,13)]
mpg am total_am
<num> <num> <int>
1: NA 1 13
2: NA 1 13
3: 22.8 1 13
4: NA 0 19
5: NA 0 19You can see that there are 13 cars with automatic transmissions and 19 cars without automatic transmissions. Each row has a 13 if it has an automatic transmission and a 19 if it does not. This calculation is something similar to what a windowing function does in SQL.
Calculate Values of Groups
It is also possible to calculate other values. In the code below, we calculate the average mpg by the number of cylinders a car has. The syntax for this code should be looking familiar by now. Notice how after the := notation, it is possible to use a function. In our case, we are using the mean() function.
# Calculate the mean mpg by cyl
mtcars[, mean_mpg:=mean(mpg,na.rm=TRUE),
            by = cyl]
mtcars[1:3,c(1,2,13)]
mpg cyl mean_mpg
<num> <num> <num>
1: 21.0 6 19.74286
2: 21.0 6 19.74286
3: 22.8 4 26.66364
The results are similar to the previous example, except this time we calculate the mean of mpg by cyl.
Using LHS := RHS Form
LHS := RHS Form is another way to indicate to R what you want to do. On the left-hand side, you create the names of your columns. After the := sign you place the functions you are using. Notice how the functions are wrapped inside parentheses with a period on the outside. Also note the comma at the beginning of the square brackets and in front of the “by” argument.
# Add columns using the LHS := RHS form
mtcars[, c("mean_mpg", "median_mpg") := .(mean(mpg), median(mpg)),
        by = cyl]
In the code above, we calculate the mean and the median mpg by the number of cylinders. Below is the output
mtcars[1:3,c(1,2,13,14)]
     mpg   cyl mean_mpg median_mpg
   <num> <num>    <num>      <num>
1:  21.0     6 19.74286       19.7
2:  21.0     6 19.74286       19.7
3:  22.8     4 26.66364       26.0
You can clearly see the two new columns that show the mean and median for mpg.
Functional Form
Functional form is another way to get the same results. In the code below, we are still using the square brackets. Inside the square brackets, we first have a comma. Next, you have our := symbol, but this time the := symbol is inside grave accents (“). The grave accent is next to the number 1 on a standard keyboard and is also home to the tilde sign (~). After the := symbol you create the column name,s followed by the function you are using, separated by commas. After all of this, you indicate the grouping using the “by” argument.
# Add columns using the functional form
mtcars[, `:=`(mean_mpg_func = mean(mpg),
               median_mpg_func = median(mpg)),
        by = cyl]
mtcars[1:3,c(1,2,15,16)]
mpg cyl mean_mpg_func median_mpg_func
<num> <num> <num> <num>
1: 21.0 6 19.74286 19.7
2: 21.0 6 19.74286 19.7
3: 22.8 4 26.66364 26.0The results speak for themselves.
Functional Form with Complex Grouping
So far, we have been grouping with only one column in the “by” argument. However, it is possible to have more than one column in the “by” argument while also having another filter in place. In the code below, we filter for mpg greater than 21 while also grouping by the number of cylinders, and whether the car has an automatic transmission or not.
# Add the mean_duration column
mtcars[mpg>21,ave_mpg :=mean(mpg),
        by = .(cyl,am)]
mtcars[1:3,c(1,2,9,17)]
mpg cyl am ave_mpg
<num> <num> <num> <num>
1: 21.0 6 1 NA
2: 21.0 6 1 NA
3: 22.8 4 1 28.075The reason for the NA is that there are no cars that meet the criteria. In other words, there was not more than one car that had an mpg greater than 21 that was 6-cylinder and also had an automatic transmission.
COnclusion
Data.table is just another way to manipulate data inside R. Generally, it is considered faster when dealing with large datasets. The purpose here was only to explore the potential of this package if it is needed.

The ideas of apocalyptic thinking and Communism are often associated with each other since COmmunism is viewed as the utopian future of the world. Joachim Fiore was a medieval monk who made significant contributions to apocalyptic thinking associated with Christianity and the Book of Revelation. Fiore was not directly linked with Communist thought, but his ideas were mixed with proto-Communism by religious leaders who came after him.

Fiore proposed the idea of the Three Ages. For Fiore, history was divided into three parts: The Age of the Father, the Age of the Son, and the Age of the Holy Spirit. The Age of the Father is associated with the Old Testament and was a time of focusing on obedience, running from creation until the birth of Christ. The Age of the Son is linked with the New Testament, which was the time from the birth of Christ until the 13th century. Lastly, the Age of the Holy Spirit began in the 13th century and is a time of universal love that would transcend the letter of the law. During this final age, man’s material body would disappear.
Splinter Groups
Fiore would inspire many apocalyptic Christian groups. The age of the Holy Spirit provided ideas for several groups that would expand on Fiore’s ideas in particular. For example, the Almaricians, an early 13th-century group, believed each of the three stages of Fiore was an incarnation. Incarnation is the belief that Christ came in the flesh. Almaricians believe they were the incarnation of the Holy Spirit. This idea implies the Almaricians were claiming to be gods and showed signs of pantheism.
Brethren of the Free Spirit
The Brethren of the Free Spirit, a group that began in the late 13th century, believed that the “Elect” would not die and would be gods on earth. Since there is no death, it implies there is no law, which makes the Brethren supporters of antinomianism (against the law). The Brethren were also supporters of taking the property of the non-elect. Seizing property is a key component of Communism.
Taborites
The Taborites emerged during the 15th century, originating from the Hussites. Their beliefs were based on the Brethren of the Free Spirit, but they believed not just in taking the property of the non-elect but in violently destroying them. This is similar to various communist purges that have taken place throughout history. The taborites did not believe in private property, believing that all things should be held in common. Strangely enough, the idea of no personal property included sexual relationships with women, which meant people were free to sleep with whoever they pleased.. Marx was a married man, but he was also critical of marriage and the family, viewing these institutions as tools that supported bourgeois society.
Adamites
The Brethren of the Free Spirit also inspired the Admites. They not only believed they were living gods but were superior to Christ. Their thought process was that since Christ died while they lived, this made them superior.
As with the Taborites, the Adamites shared all goods in common while having conflicting views on chastity. There was no marriage, and people in theory could sleep with whoever they wanted. In practice, sex was restricted because everyone had to get permission from the leader to sleep with each other.
Another unusual belief of this group is the practice of walking around naked. Adamites believe that walking around naked, as Adam and Eve did, is important to reflect the perfect love of the original couple. However, walking around naked did not discourage the belief in destroying the non-Elect. The Adamits were eventually destroyed due in part to their heretical beliefs.
Conclusion
The motivation behind each of these groups was that, by stripping people of autonomy and sacrificing individual desires for the group, it would lead to a heaven on earth. Of course, autonomy and personal desire are what fuel progress. Therefore, by removing this, you bring a form of peace without the necessary motivation to maintain the utopia. Individualism is a two-edged sword that brings the benefits of ambition with the downside of selfishness and oppression.
Furthermore, one thing Christians and Communists have in common is a desire for a better world here. The difference is in whether or not freedom will be a part of this new world.
The video below provides examples of ways to manipulate data and conduct various calculations using data.table in R


Reabsorption Theology is not a religious term. Rather, this term was developed by Leszek Kołakowski to explain the problem that Communism and other ideologies attempt to address regarding human behavior and the apparent separation between humans and God.
Definition
Reabsorption theology posits that the end of humanity will culminate in its reabsorption into the essence or nature of divinity. In other words, man must return to God. Another key term is alienation. Alienation, as defined in Communism, is separation not only from one’s work and fellow man but also from god. Therefore, the ultimate purpose of Communism is to end alienation, unite man with man, and humanity with god. As such, Communism is much bigger than just the emancipation of the proletariat.
Kolakowski states that God created the world and separated it from himself because he was lonely. He continues by stating that there are three stages to existence. The first is pre-creation, when God is alone. The second is post-creation, when there is a separation between God and the rest of reality. Finally, there is a reunion when man is reabsorbed into God.
The Problem
The problem with creation is that once it was separated from God, it became evil. The logic behind this thought is that if God is good, being separate from him is bad or evil. As such, as soon as man was separated from God, man was evil. The idea of an inherently evil creation is in stark contrast to Christianity, which states explicitly that creation was good. With this assumption of an evil of creation, Communism is seen as the solution to this corruption of man, and it will be the process used to reunite man with God.

The idea that man must reunite with God is not unique to Communism and is found in such religions as Hinduism and faintly in Buddhism. The first man emerged from Brahma in Hinduism. The motivation of Brahma to create humans was due to loneliness, but there are various interpretations of this.
Buddhism skips explaining creation and focuses on the endless cycle of life, birth, and death. The purpose of this process is almost a form of purification. As an individual lives over and over, hopefully they eventually awaken (reach enlightenment) and achieve Nirvana, which is challenging to define but involves the extinction of desire and perhaps removal from this plane of existence.
Christianity does not suggest that man will be reabsorbed, but it does state that the relationship between man and God will be reestablished like a husband and wife reconciling after a severe conflict. In Christianity, the problem is not that man is separate from God but that the relationship between man and God has been strained by sin. By reestablishing this broken relationship, man is united with God in a way that a family is united. One family, but individual members have personal autonomy.
The Solution
The solution of unification, as determined by Communism, is for all of mankind and not for the individual. What this means is that people on the individual level do not have a choice in this process. True “freedom” can only happen through the submergence of self into the state and the removal of diversity. Everyone must conform, or nobody gets the reward. Therefore, the elimination of non-conformers is a necessary sacrifice for the greater good. This has led to the murder of millions in various iterations of Communism.
Individuality is the origin and source of greed and strife because people are thinking of themselves over the group. Communism will always have issues with individualism, as individualistic people are materialistic in their eyes. In other words, individuality leads to greed and strife as these behaviors contribute to alienation and separation from God. By destroying individuality, the fruit of this behavior is also destroyed, and reabsorption can transpire.
The idea that man and God need to reunite suggests that man and God are essentially equal and that neither is perfect without the other. This idea is not generally associated with mainline Christian thought, which views God as self-sufficient with a desire to save fallen man if they are willing to accept his help.
Conclusion
Reabsorption theology is an interesting idea that attempts to explain the motivations of Communism. However, it is an outsider’s perspective on the motivations of people who hold a particular ideology. Kołakowski was anti-communist, and it would be hard for his opinion to be unbiased. Despite this, his ideas concerning reabsorption provide an interesting insight into understanding Communism.
In the video below, we will look at how to perform various column-wise computations with data tables in R.

Data tables provide an efficient way to work with and manipulate data. In the video below, examples are provided of the strengths and benefits of using data tables.

Annotations add text and other objects to a visualization to provide information. The video below explains how to add annotations to a visualization when using Python.

In this post, we will look at some common characteristics of Communism. Naturally, this is not an exhaustive list; however, it does provide a basic introduction to these commonly held traits.
Restrictions on Property
One of the most common tenets of Communism is restrictions on property. Commonly, this has been interpreted as no private property. Several attempts at Communism have removed all private property rights, such as in the Soviet Union. Marx did dislike private property, but he truly hated individual ownership of the means of production. Anything that could produce wealth should be owned by the people, in Marx’s opinion.
Therefore, and much to many people’s surprise, Marx may not have had issues with people owning homes, computers, phones, or cars, but he would challenge a person’s right to own farmland, factories, or businesses. Consumption was fine as long as production was controlled centrally.
Loss of Individualism
Many interpretations of Communism involve the sacrifice of the individual for the collective. Individualism is often seen as a threat because, to have a communist society, everyone must go along with it. In other words, for true Communism to arise, everyone must support it so that the state withers away. Particularly for Communists who ascribe and yearn for a utopia, this heaven on earth cannot transpire until dissent is removed.

This desire for a man-made, secular heaven explains in part the tremendous amount of persecution and death that is associated with Communism. Unlike capitalism, which may abuse power to make more money, Communism will abuse power to bring about a new earth in which there is no more strife. In other words, the sacrifice of the few to save the many.
Examples of the destruction of countless lives in the pursuit of Communism can be found in the millions who died in the Soviet Union, China, and Cambodia. Dissenters and even apparent dissenters were systematically destroyed or “reeducated.” All this was done in the name of the people to bring about a better world.
Upheaval of Social Order
Communism brings about a total upheaval of the social order. Marx makes it clear that the working class, or proletariat, needs to rise and overthrow the bourgeoisie. Later, Communist thinkers such as Marcuse included minorities (whether sexual, racial, gender, etc.) as part of the revolution. Eventually, everyone is included as oppressed, thanks to the splintering of people into oppressed groups that encompass anyone who is not part of the normalized society.
The destruction of the current oppressors creates a vacuum that the rising Communist leaders fill. Essentially, Communism throws out one corrupt government to bring in another. The new leaders claim to be for the people, but eventually become accustomed to doing whatever it takes to maintain their power. An example would be what has happened in Cuba, China, and North Korea over the past 80 years. Each of these governments used Communism to take power and has used it to maintain power.
Religious Undertones
Even though Marx despised religion, Communism is often treated as a religion. Some adherents of Communism truly believe that implementing this belief system will lead to peace and prosperity on Earth in a way that believers in Christianity believe in heaven.
Even with all the evidence to the contrary that Communism does not work, believers fight to preserve the idea of Communism. A common counterargument is that Communism has never been implemented properly or that the famous leaders of Communism misunderstood it.
For example, the focus of Communism was primarily economic, with an emphasis on the means of production. However, as the middle class rose and became content, many communist thought leaders moved from attacking the means of production to critiquing the cultural reproduction of society. This is why there is so much criticism of Judeo-Christian-Heterosexual-White norms in the West today. Pulling down these norms today is the equivalent of seizing the factories of the bourgeoisie in the 19th century.
Communism seeks to displace other religious systems to generate a religion in which man is God rather than the gods of various religions. Marx viewed religion as a tool that kept people asleep and ignorant of their condition. This has been interpreted as the need to destroy religion by many so that the masses are awakened or “woke.” Evangelism is performed with protesting in the streets and or the barrel of a gun rather than with the persuasion of the Bible.
Conclusion
Communism is a complex ideology that has had a major influence on the world. For better or for worse, people believe that the ideas of Communism will make the world a better place. As such, there have been attempts to realize the ideas of the philosophy with mixed results. Despite the implementation, the traits described here are generally present when Communists take power.

In this post, we will go over more examples of how to manipulate data with data.table in R. We will begin by loading the needed packages and preparing our data.
Packages and Data Preparation
In the code below, we load our library data.table. Next, we prepare our data set mtcars and convert it into a data.table of the same name. Note that mtcars is preloaded within R.
library(data.table)
mtcars<-data.table(mtcars)
Below is a preview of the mtcars dataset.
> head(mtcars)
     mpg   cyl  disp    hp  drat    wt  qsec    vs    am  gear  carb
   <num> <num> <num> <num> <num> <num> <num> <num> <num> <num> <num>
1:  21.0     6   160   110  3.90 2.620 16.46     0     1     4     4
2:  21.0     6   160   110  3.90 2.875 17.02     0     1     4     4
3:  22.8     4   108    93  3.85 2.320 18.61     1     1     4     1
4:  21.4     6   258   110  3.08 3.215 19.44     1     0     3     1
5:  18.7     8   360   175  3.15 3.440 17.02     0     0     3     2
6:  18.1     6   225   105  2.76 3.460 20.22     1     0     3     1
Selecting Columns
Below is an example of how to select columns. You can do this by using brackets and placing the columns you want inside the c function. Remember to place a comma in front of the c function, as this indicates to take all rows of data, while the information after the comma indicates which columns to take.
# Select mpg and cyl using a character vector
> mtcars_select <- mtcars[,c("mpg","cyl")]
> head(mtcars_select)
   mpg cyl
1 21.0   6
2 21.0   6
3 22.8   4
4 21.4   6
5 18.7   8
6 18.1   6
By indicating which columns we wanted, we were able to pull only what we wanted. If you want to leave out columns, you just need to place a minus sign in front of the c function as shown below.
> # Deselect mph and cyl columns
> mtcars_drop <- mtcars[,-c("mpg","cyl")]
> head(mtcars_drop)
    disp    hp  drat    wt  qsec    vs    am  gear  carb
   <num> <num> <num> <num> <num> <num> <num> <num> <num>
1:   160   110  3.90 2.620 16.46     0     1     4     4
2:   160   110  3.90 2.875 17.02     0     1     4     4
3:   108    93  3.85 2.320 18.61     1     1     4     1
4:   258   110  3.08 3.215 19.44     1     0     3     1
5:   360   175  3.15 3.440 17.02     0     0     3     2
6:   225   105  2.76 3.460 20.22     1     0     3     1
In the example above, the columns left out are mpg and cyl, as we indicated. Next, we will look at performing calculations.
Performing Calculations
It is also possible to perform specific calculations. In the example below, we calculate the median mpg of all cars in the dataset.
> # Calculate median mpg using the j argument
> median_mpg <- mtcars[,median(mpg)]
> median_mpg
[1] 19.2
As you can see, to perform a calculation, you must place the function inside the brackets and after the comma. The column you want to perform the calculation on must be inside the formula, as usual.
It is also possible to give names to your output. In the example below, we provide the output of our calculation, the name “mean_mpg”. Notice also the use of the period right in front of the parentheses, which is needed when performing this type of calculation
> # Calculate the average mpg as mean_mpg
> mean_mpg <- mtcars[,.(mean_mpg=mean(mpg))]
> mean_mpg
   mean_mpg
       <num>
1:  20.09062
In our example above, we can see that the average mpg of all the cars in our dataset is 20.09.
Multiple Calculations
By employing the same dot notation, it is possible to perform multiple calculations at once. In the example below, we find the minimum and maximum values of mpg for all cars.
> # Get the min and max mpg values
> min_max_mpg <- mtcars[, .(min(mpg),max(mpg))]
> min_max_mpg
      V1    V2
   <num> <num>
1:  10.4  33.9
There is nothing unique here except for the inclusion of a second function. Notice how each function is separated by a comma.
Just as before, you can also name each output from your results. Below is the mean weight and the max hp from the dataset.
> # Calculate the average wt and the max hp
> other_stats <- mtcars[, .(mean_wt=mean(wt),max_hp=max(hp))]
> other_stats
   mean_wt max_hp
     <num>  <num>
1: 3.21725    335
Filtering and Calculations
So far, we have not made any adjustments to the input before the comma when performing calculations. In the example below, we are filtering for cars with 6 cylinders and hp that is less than 120. Once this is filtered, we then want to calculate the minimum and maximum mpg.
> #filter for two or more variables then statistics
> mpg_stats <- mtcars[cyl==6 & hp<120, .(min_dur=min(mpg),
+                             max_dur=max(mpg))]
> mpg_stats
   min_dur max_dur
     <num>   <num>
1:    18.1    21.4
The output speaks for itself. Normally, when subsetting data, the information before the comma indicates the rows. However, when performing calculations, the information before the comma can be used to filter the data as appropriate.
In the example below, we make a histogram based on the same filtering criteria.
mtcars[cyl==6 & hp<120,
                    hist(mpg)]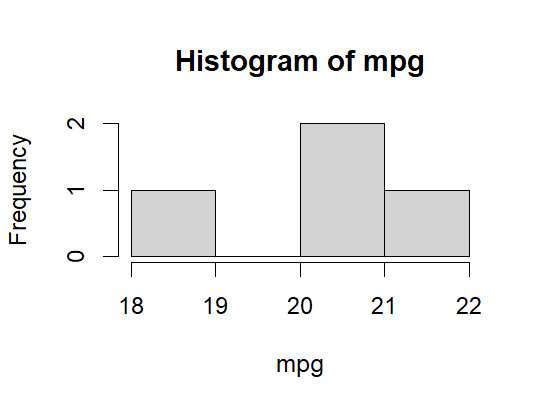
As you can see, the use of data.table is almost endless
Conclusion
The data.table library provides you with several beneficial tools for conveniently slicing data. Data analysis can use these tools as needed to provide insights for their audience.
The data table data structure is a great way to manipulate your data to address various questions you may have. In this post, we will learn about filtering, dealing with text, and more complex numerical calculations.
Packages and Data Preparation
We will begin by loading our package data.table and converting our datasets mtcars and iris, into data tables. Both mtcars and iris are preinstalled on R. Below is the code.
library(data.table)
mtcars<-data.table(mtcars)
iris<-data.table(iris)
Next, we will quickly examine both datasets using the head() function to understand what each one is about.

We now move to filtering.
Filtering for Not
Our first exercise is the use of NOT logic in filtering. With NOT logic, you are filtering for what is not included in your code. For example, in the code below, we are telling R to display all cars that do not have a transmission. The code for NOT is != which means “does not equal”. Below is the code and example.
> # Filter all rows where am is not 0
> not_0_am <- mtcars[am !=0]
> not_0_am
      mpg   cyl  disp    hp  drat    wt  qsec    vs    am  gear  carb
    <num> <num> <num> <num> <num> <num> <num> <num> <num> <num> <num>
 1:  21.0     6 160.0   110  3.90 2.620 16.46     0     1     4     4
 2:  21.0     6 160.0   110  3.90 2.875 17.02     0     1     4     4
 3:  22.8     4 108.0    93  3.85 2.320 18.61     1     1     4     1
 4:  32.4     4  78.7    66  4.08 2.200 19.47     1     1     4     1
 5:  30.4     4  75.7    52  4.93 1.615 18.52     1     1     4     2
 6:  33.9     4  71.1    65  4.22 1.835 19.90     1     1     4     1
 7:  27.3     4  79.0    66  4.08 1.935 18.90     1     1     4     1
 8:  26.0     4 120.3    91  4.43 2.140 16.70     0     1     5     2
 9:  30.4     4  95.1   113  3.77 1.513 16.90     1     1     5     2
10:  15.8     8 351.0   264  4.22 3.170 14.50     0     1     5     4
11:  19.7     6 145.0   175  3.62 2.770 15.50     0     1     5     6
12:  15.0     8 301.0   335  3.54 3.570 14.60     0     1     5     8
13:  21.4     4 121.0   109  4.11 2.780 18.60     1     1     4     2
>
Of course, you can have more than one argument within your code, as we will see in the next example.
Multiple Commands for Not
It is also possible to include multiple commands. In the example below, we are filtering for cars with an automatic transmission (am==1) but do not have 6 cylinders (cyl != 6). The output matches the criteria that were set
> # Filter all rows where am is 0 AND cyl is not 6
> am_cyl <- mtcars[am==1 & cyl != 6]
> am_cyl
      mpg   cyl  disp    hp  drat    wt  qsec    vs    am  gear  carb
    <num> <num> <num> <num> <num> <num> <num> <num> <num> <num> <num>
 1:  22.8     4 108.0    93  3.85 2.320 18.61     1     1     4     1
 2:  32.4     4  78.7    66  4.08 2.200 19.47     1     1     4     1
 3:  30.4     4  75.7    52  4.93 1.615 18.52     1     1     4     2
 4:  33.9     4  71.1    65  4.22 1.835 19.90     1     1     4     1
 5:  27.3     4  79.0    66  4.08 1.935 18.90     1     1     4     1
 6:  26.0     4 120.3    91  4.43 2.140 16.70     0     1     5     2
 7:  30.4     4  95.1   113  3.77 1.513 16.90     1     1     5     2
 8:  15.8     8 351.0   264  4.22 3.170 14.50     0     1     5     4
 9:  15.0     8 301.0   335  3.54 3.570 14.60     0     1     5     8
10:  21.4     4 121.0   109  4.11 2.780 18.60     1     1     4     2
Searching Text
It is also possible to search for text and even numbers. In the code below, we are searching the iris dataset for the species “setosa” and for petal lengths that are less than 1.3
> #with text
> iris[Species=="setosa" & Petal.Length<1.3]
   Sepal.Length Sepal.Width Petal.Length Petal.Width Species
          <num>       <num>        <num>       <num>  <fctr>
1:          4.3         3.0          1.1         0.1  setosa
2:          5.8         4.0          1.2         0.2  setosa
3:          4.6         3.6          1.0         0.2  setosa
4:          5.0         3.2          1.2         0.2  setosa
We can also search for text when unsure what we are looking for. In the example below, we use the %like% argument to search the Specias column for text containing the letter v. Since the results are rather long, we use the head() function to see the first few rows.
> # Filter all rows where Species contains "V"
> any_v <- iris[Species %like% "v"]
> head(any_v)
   Sepal.Length Sepal.Width Petal.Length Petal.Width    Species
          <num>       <num>        <num>       <num>     <fctr>
1:          7.0         3.2          4.7         1.4 versicolor
2:          6.4         3.2          4.5         1.5 versicolor
3:          6.9         3.1          4.9         1.5 versicolor
4:          5.5         2.3          4.0         1.3 versicolor
5:          6.5         2.8          4.6         1.5 versicolor
6:          5.7         2.8          4.5         1.3 versicolor
Another way to search text is by looking for words that end with something. In the example below, we are looking for words in the Species column that end with the word “color.” We indicate this to are by using the %like% argument again and the word “color” with a dollar sign at the end of it. The dollar sign tells R to look for this word at the end of a word in the Species column.
> # Filter all rows where Species ends with "color"
> end_flowers <- iris[Species %like% "color$"]
> head(end_flowers)
   Sepal.Length Sepal.Width Petal.Length Petal.Width    Species
          <num>       <num>        <num>       <num>     <fctr>
1:          7.0         3.2          4.7         1.4 versicolor
2:          6.4         3.2          4.5         1.5 versicolor
3:          6.9         3.1          4.9         1.5 versicolor
4:          5.5         2.3          4.0         1.3 versicolor
5:          6.5         2.8          4.6         1.5 versicolor
6:          5.7         2.8          4.5         1.3 versicolor
Multiple Numerical Arguments
Multiple numerical arguments are also possible. In the example shown below, we are looking for all cars in the mtcars dataset that are 4 or 6 cylinders. We achieve this by listing the variable we are searching “cyl” followed by the %in% argument, and lastly we use the c() function and include our values inside it. Below is the code and output.
> # Filter all rows where cyl is 4 or 6
> filter_cyl <- mtcars[cyl %in% c(4, 6)]
> filter_cyl
      mpg   cyl  disp    hp  drat    wt  qsec    vs    am  gear  carb
    <num> <num> <num> <num> <num> <num> <num> <num> <num> <num> <num>
 1:  21.0     6 160.0   110  3.90 2.620 16.46     0     1     4     4
 2:  21.0     6 160.0   110  3.90 2.875 17.02     0     1     4     4
 3:  22.8     4 108.0    93  3.85 2.320 18.61     1     1     4     1
 4:  21.4     6 258.0   110  3.08 3.215 19.44     1     0     3     1
 5:  18.1     6 225.0   105  2.76 3.460 20.22     1     0     3     1
 6:  24.4     4 146.7    62  3.69 3.190 20.00     1     0     4     2
 7:  22.8     4 140.8    95  3.92 3.150 22.90     1     0     4     2
 8:  19.2     6 167.6   123  3.92 3.440 18.30     1     0     4     4
 9:  17.8     6 167.6   123  3.92 3.440 18.90     1     0     4     4
10:  32.4     4  78.7    66  4.08 2.200 19.47     1     1     4     1
11:  30.4     4  75.7    52  4.93 1.615 18.52     1     1     4     2
12:  33.9     4  71.1    65  4.22 1.835 19.90     1     1     4     1
13:  21.5     4 120.1    97  3.70 2.465 20.01     1     0     3     1
14:  27.3     4  79.0    66  4.08 1.935 18.90     1     1     4     1
15:  26.0     4 120.3    91  4.43 2.140 16.70     0     1     5     2
16:  30.4     4  95.1   113  3.77 1.513 16.90     1     1     5     2
17:  19.7     6 145.0   175  3.62 2.770 15.50     0     1     5     6
18:  21.4     4 121.0   109  4.11 2.780 18.60     1     1     4     2
In this last example, we learn to find data that meets a range rather than just specific values. In the code below, we are looking for cars that have an mpg between 20 and 22. The new argument in this example is the %between% argument, which is used to tell R to search for a range of values. Below is the code, followed by the output
> # Filter all rows where mpg is between [20, 22]
> mpg_20_22 <- mtcars[mpg %between% c(20,22)]
> mpg_20_22
     mpg   cyl  disp    hp  drat    wt  qsec    vs    am  gear  carb
   <num> <num> <num> <num> <num> <num> <num> <num> <num> <num> <num>
1:  21.0     6 160.0   110  3.90 2.620 16.46     0     1     4     4
2:  21.0     6 160.0   110  3.90 2.875 17.02     0     1     4     4
3:  21.4     6 258.0   110  3.08 3.215 19.44     1     0     3     1
4:  21.5     4 120.1    97  3.70 2.465 20.01     1     0     3     1
5:  21.4     4 121.0   109  4.11 2.780 18.60     1     1     4     2
Conclusion
Data tables provide a different way of pulling insights from data. The value of this approach becomes clearer when dealing with large datasets in which speed becomes important.
The comparison of data can be useful to determine if it is necessary to use additional statistical tests to confirm a significant difference. In the video below, we look at several simple ways to compare data using Python.


Annotating data allows you to communicate vital information in a visualization for an audience. In the example below, we will look at how to annotate a visualization while using Python.
Libraries and Data Preparation
We will begin by loading the needed libraries and preparing the data. In the code below, lines 1 and 3 load our visualization libraries. Line 2 loads the function we will need to load our data.
import seaborn as sns
from pydataset import data
import matplotlib.pyplot as plt
In the code below, we use the data() function to load the Prestige data from pydataset into an object called df. Then, we display the head of this data using the .head() method.
df=data('Prestige')
df.head()
Our dataset contains various jobs measured on five dimensions. In our code below, we will focus on using the education, income, and prestige variables.
Making a Comment
Now we will add a comment to our visualization. Specifically, we will point out the highest income value. Below is the code, followed by the visualization
# Draw basic scatter plot of education data and income
sns.scatterplot(x = 'education', y = 'income', data = df)

# Label highest income value with text annotation
plt.text(6, 25000,
         'The max income is over 25000',
         # Set the font to large
         fontdict = {'ha': 'left', 'size': 'large'})
plt.show()
The first step was to make a basic scatterplot. We use the .scatterplot() method from seaborn and plot education and income from our df dataset. Next, we set up our text using the .text() method from matplotlib. For the text, we set an x and y value and then indicate what the text should say. Below that, we adjust the font to come from the left and top to be large in size.
Arrow Annotation
Using an arrow is another way to bring attention to data in a visualization. In the code below, we will use an arrow that will point to the same data point that we used in the previous example. Below is the code, followed by the visualization.
# Query and filter to General Managers
women_census = df.query("(women  ==  4.02) & (census  ==  1130)")
prestige_type = df.query("(prestige  ==  69.1) & (type  ==  'prof')")

sns.scatterplot(x = 'education', y = 'income',
                data = df)

# Point arrow to General Managers
plt.annotate('General Managers',
             xy = (women_census.education, prestige_type.income),
             xytext = (6.5, 15000),
             # Shrink the arrow to avoid occlusion
             arrowprops = {'facecolor':'gray', 'width': 3, 'shrink': 0.03},
             backgroundcolor = 'white')
plt.show()
Here is what we did,

These two objects are used to locate general managers in the dataset.
2. We make the same scatterplot as shown before
3. The .annotate() method is used. We start by writing in quotes what we want to appear in the scatterplot. Next, we set the x and y coordinates of the data point we want to highlight using the women_census and prestige_type queries we did previously. From there, we have to set the text location. After this, we set the arrow properties in terms of the color, width, and size. Lastly, the background color is set.
Annotation with Color & Text
Color annotation provides a contrast based on color. Below is the code and the visualization when this approach is used.
# Make a vector where prof is orangered; else lightgray
prof = ['orangered' if type  ==  'prof' else 'lightgray' for type in df['type']]

# Map facecolors to the list prof and set alpha to 0.3
sns.regplot(x = 'education',
            y = 'income',
            data = df,
            fit_reg = False,
            scatter_kws = {'facecolors':prof, 'alpha': 0.3})

# Add annotation to plot
plt.text(11, 23000, 'General Managers')
plt.show() 
This approach is simpler compared to the last one. We begin by separating the data based on type. Professionals are colored orange, and the rest are colored light gray. Next, we create our scatterplot using the .regplot() method this time. Education and income are the x and y axes, the regression line is removed, and the color of the dots is set using the scatter_kws argument. The “prof” argument provides the coloring rules, and the alpha is set to make the points transparent. The next step uses the .text() method to set the x and y coordinates for the text.
Conclusion
Annotation is one of many ways to bring attention to crucial insights in a visualization. The examples above provide some of the many ways this tool can be used to provide crucial information when using Python
The video below provides two methods that can be used to highlight data points using Python. Which method to use depends on the context, but an analyst should be familiar with both.


Data frames are the default way that data is often stored in R. However, another option for storing data in R is using data tables. As we will see, data tables allow you to accomplish much more than data frames. For now, we will focus on some basic features of data tables and data frames before moving to actions that are easier to perform with data tables.

Loading Packages and Data Preparation
We will start by loading the package data.table and preparing our data. The data.table package is loaded using the library() function. We will use the mtcars and iris datasets for the various examples. Both of these datasets are available by default within R. Since our focus is on data tables, we will convert both the mtcars and iris datasets into data tables and store them in objects with the same name. Below is the code.
library(data.table)
mtcars<-data.table(mtcars)
iris<-data.table(iris)
Next, we will use the head () function to examine the mtcars and iris datasets quickly.
The mtcars dataset has data about cars while the iris dataset has data bout various features of flowers.
Subsetting Basics
The first five examples can be performed data frames or data tables. We will begin by subsetting a single row from a data table as shown below.
#filtering with positive integers
row_2 <- mtcars[2,]
row_2
  mpg cyl disp  hp drat    wt  qsec vs am gear carb
2  21   6  160 110  3.9 2.875 17.02  0  1    4    4
In the code above, we filter for the second row in the mtcars data table. This is done using brackets followed by a number for the row we want. The common after the number 2 in the brackets would allow us to select a column. Since there is no number after the comma, this indicates that R should select all rows. This is why we have all the data from row number 2.
In the example below, we will select multiple rows at once using the c() function and a colon.
#multiple rows
> rows_1_5 <- mtcars[c(1:5),]
> rows_1_5
   mpg cyl disp  hp drat    wt  qsec vs am gear carb
1 21.0   6  160 110 3.90 2.620 16.46  0  1    4    4
2 21.0   6  160 110 3.90 2.875 17.02  0  1    4    4
3 22.8   4  108  93 3.85 2.320 18.61  1  1    4    1
4 21.4   6  258 110 3.08 3.215 19.44  1  0    3    1
5 18.7   8  360 175 3.15 3.440 17.02  0  0    3    2
The main difference in the code above is the use of the c() function or the concatenate function. Inside this function, we tell R we want the first 5 rows and columns. However, it is not necessary to pull consecutive rows, as we can also pull whatever rows we want specifically.
#filtering non consecutive rows
rows_1_3_5 <- mtcars[c(1,3,5),]
rows_1_3_5
   mpg cyl disp  hp drat   wt  qsec vs am gear carb
1 21.0   6  160 110 3.90 2.62 16.46  0  1    4    4
3 22.8   4  108  93 3.85 2.32 18.61  1  1    4    1
5 18.7   8  360 175 3.15 3.44 17.02  0  0    3    2
In the next example above, inside the c() function, we indicate that we want the 1st, 3rd, and 5th rows along with all of the columns. In the next two examples, we will learn how to leave rows rather than include them.
> only_last_two <- mtcars[-c(1:30),]
> only_last_two
    mpg cyl disp  hp drat   wt qsec vs am gear carb
31 15.0   8  301 335 3.54 3.57 14.6  0  1    5    8
32 21.4   4  121 109 4.11 2.78 18.6  1  1    4    2
You can use a minus sign in front of your subset to remove everything that is inside the brackets. For example, in the code above, we place a minus sign in front of rows 1 to 30 to indicate to R to remove rows 1 to 30. This is why in the output, only rows 31 and 32 are available. Just as in the other examples, the numbers do not have to be consecutive, as shown below
> exclude_some <- mtcars[-c(1:10,12:32),]
> exclude_some
    mpg cyl  disp  hp drat   wt qsec vs am gear carb
11 17.8   6 167.6 123 3.92 3.44 18.9  1  0    4    4
In the above example, we exclude rows 1 to 10 and rows 12 to 32, leaving only row 11.
Using data.table
We will now do three examples that require the use of data.table. The first example below removes the first 30 rows and the last row of 32, which means only row 31 is displayed
> not_first_last <- mtcars[-c(1:30,.N)]
> not_first_last
     mpg   cyl  disp    hp  drat    wt  qsec    vs    am  gear  carb
   <num> <num> <num> <num> <num> <num> <num> <num> <num> <num> <num>
1:    15     8   301   335  3.54  3.57  14.6     0     1     5     8
If you look closely, the output is different. There is a 1 next to all of the data, which gives the impression that this is row 1 from the dataset. However, this is not row 1 of the dataset but rather the first row of the subsetted data. In addition, you can see the <num> above all columns, which means this data is numerical. Lastly, in the code, you see a .N, which tells R to remove the last row of the data.
In the next example, we are going to subset the data so that only cars with an automatic transmission appear (am==1).
> am_1 <- mtcars[am == 1]
> am_1
      mpg   cyl  disp    hp  drat    wt  qsec    vs    am  gear  carb
    <num> <num> <num> <num> <num> <num> <num> <num> <num> <num> <num>
 1:  21.0     6 160.0   110  3.90 2.620 16.46     0     1     4     4
 2:  21.0     6 160.0   110  3.90 2.875 17.02     0     1     4     4
 3:  22.8     4 108.0    93  3.85 2.320 18.61     1     1     4     1
 4:  32.4     4  78.7    66  4.08 2.200 19.47     1     1     4     1
 5:  30.4     4  75.7    52  4.93 1.615 18.52     1     1     4     2
 6:  33.9     4  71.1    65  4.22 1.835 19.90     1     1     4     1
 7:  27.3     4  79.0    66  4.08 1.935 18.90     1     1     4     1
 8:  26.0     4 120.3    91  4.43 2.140 16.70     0     1     5     2
 9:  30.4     4  95.1   113  3.77 1.513 16.90     1     1     5     2
10:  15.8     8 351.0   264  4.22 3.170 14.50     0     1     5     4
11:  19.7     6 145.0   175  3.62 2.770 15.50     0     1     5     6
12:  15.0     8 301.0   335  3.54 3.570 14.60     0     1     5     8
13:  21.4     4 121.0   109  4.11 2.780 18.60     1     1     4     2
Within the brackets, you simply indicate what values you want for the column that is being used for the filtering. Naturally, you can create more complex queries as shown below.
> am_1_mpg_25 <- mtcars[am==1 & mpg > 25]
> am_1_mpg_25
     mpg   cyl  disp    hp  drat    wt  qsec    vs    am  gear  carb
   <num> <num> <num> <num> <num> <num> <num> <num> <num> <num> <num>
1:  32.4     4  78.7    66  4.08 2.200 19.47     1     1     4     1
2:  30.4     4  75.7    52  4.93 1.615 18.52     1     1     4     2
3:  33.9     4  71.1    65  4.22 1.835 19.90     1     1     4     1
4:  27.3     4  79.0    66  4.08 1.935 18.90     1     1     4     1
5:  26.0     4 120.3    91  4.43 2.140 16.70     0     1     5     2
6:  30.4     4  95.1   113  3.77 1.513 16.90     1     1     5     2
IN the last example, we filtered the data for cars with automatic transmissions and with mpg above 25.
Conclusion
Data tables are highly flexible and allow a user to do things in a way that is much more efficient, depending on the situation. This is yet another excellent tool that can be deployed by an R enthusiast.

Comparing groups within a dataset is another aspect of analysis. Here, we will use some tools from Python.
Libraries & Data Prep
First, we need to load our libraries and prepare our data. Below is the code for the libraries we need.
import seaborn as sns
from pydataset import data
import matplotlib.pyplot as plt
The first and last lines load the libraries we need for data visualization. The second line loads the data() function from pydataset, where our data will come from. Below is the code for loading our data.
df=data('Prestige')
df.head()
Our data is the Prestige dataset from the data() function, loaded as the object df. The .head() method displays the first few lines of our dataset. This dataset contains various jobs measured in terms of education, income, women, prestige, census, and type. We are now ready to create our first comparison.
Histogram Comparision
The histogram comparison allows us to compare the shape of different distributions of data when the histograms overlap each other. We will compare the income distribution by job type in the code below.
# Filter dataset for prof
sns.kdeplot(df[df.type == 'prof'].income,
            # Shade under kde and add a helpful label
            fill = True,
            label = 'prof')

# Filter dataset for non prof
sns.kdeplot(df[df.type != 'prof'].income,
            # Again, shade under kde and add a helpful label
            fill = True,
            label = 'non-prof')
plt.show()
We create the first plot (blue color) by submitting the data for “prof” and income. We repeat this process and subset the data for individuals who are not “prof.”The plot shows that there is a broader distribution of income for people whose job type is professional. We could confirm this with a t-test or ANOVA, but the visual can often help to determine if statistical testing is appropriate
Rug Plot
A rug plot serves a similar purpose to a histogram. The main difference is that a rug plot includes ticks along the x-axis that help to show where data points are located. This knowledge can be used to remove outliers when necessary. Below is the code, output, and explanation of how to create a rug plot.
sns.kdeplot(df[df.type == 'prof'].income,
             label = 'prof',
             # Turn the color blue to stand out
             color = 'green')

sns.kdeplot(df[df.type != 'prof'].income,
             label = 'Other types',
             # Turn the color gray
             color = 'red')
# Turn on rugplot
sns.rugplot(df[df.type == 'prof'].income,
             label = 'prof',
             color = 'green')

sns.rugplot(df[df.type != 'prof'].income,
             label = 'Other types',
             color = 'red')
plt.show()
The first two blocks of code are the same as the last example and make the histograms. The main difference is that no color fills the inside of the histograms. The new code is the two blocks of code that use the rugplot() method. The code for the arguments within the ruplot() method is almost the same as for the histogram, so there is little to discuss.
Swarm Plot
The swarm plot provides a different way to visualize a distribution. Like the histogram, it can be useful for comparison. In the code below, we use a swarm plot to look at the distribution of education by job type.
# Plot beeswarm
sns.swarmplot(y = "type",
              x = 'education',
              data = df,
              # Decrease the size of the points to avoid crowding
              size = 3)

# Give a descriptive title
plt.title('Education and Type')
plt.show()
The code is straightforward. You use the swarmplot() method and put in your values for the x and y axes. The plot shows you that prof job types have a higher level of education compared to the other job types.
Conclusion
People have their preferences for how they want to view data. The point here was not to state that one method was better than another. Rather, the goal was to raise awareness of the available options and to show how they can be created using Python.

In this post, we are going to look at how to highlight data points in a scatterplot. We will specifically look at two different methods for doing this. These two methods are hard coding and programmatically.
Libraries and Data Preparations
First, we will load our libraries and prepare our data. Below are the libraries we will use
import seaborn as sns
import matplotlib.pyplot as plt
from pydataset import data
The first two lines are libraries for our data visualization. The last line of code will be used for pulling the data that we will use. Below we prepare our data by loading it into an object called “df” and we take a quick peek at it as well.
df=data('Prestige')
df.head()
The data set we are using is called “Prestige” and we load it using the data() function. This data contains various jobs, education, income, women, prestige, census, and type information. Next, we will look at how to highlight a specific data point in a scatterplot.
Hard Coding
Hard coding is when you manually pick a specific data point to highlight. Below is the code and output for this
df_prof = df[df.type  ==  'prof']

# Make array orangred for highest income
prof_colors = ['orangered' if (education  ==  12.26) & (income  ==  25879) else 'lightgray'
                  for education,income in zip(df_prof.education, df_prof.income)]

sns.regplot(x = 'education',
            y = 'income',
            data = df_prof,
            fit_reg = False,
            # Send scatterplot argument to color points
            scatter_kws = {'facecolors': prof_colors, 'alpha': 0.7})
plt.show()
We did the following to make the plot above.


Notice the second row and how it is labeled “orangered” this is because this row matches the criteria for the values of education and income. We will use this object to make the colors of our dots
3. The next block of code is for making the visualization. Most of this is self-explanatory. You set your x and y values for education and income,. The fit_reg argument was set to false because we do not want a regression line. The scatter_kws argument is used to set the color of the dots and the alpha sets the level of transparency of the dots.
Setting the highlighted point manually is good if your data is static. However, if your data is dynamic, you want to highlight the points programmatically so that the highlight point changes as the data does.
Progammatically
The code is mostly similar as above with a few minor changes. Below is the code followed by the output and lastly the explanation.
df_prof = df[df.type  ==  'prof']

# Find the highest income
max_income = df_prof.income.max()

# Make a column that denotes which occuaption has highest income
df_prof['point_type'] = ['Highest Income' if income  ==  max_income else 'Others' for income in df_prof.income]

# Encode the hue of the points with the O3 generated column
sns.scatterplot(x = 'education',
                y = 'income',
                hue = 'point_type',
                data = df_prof)
plt.show()
Here is what we did
With this second method, our highlighted data point will change as necessary if it changes in the data.
Conclusion
Highlighting data points is something that is needed at times when creating data visualizations. The examples above provide two different ways to deal with this. Which method is best depends on the context.

Program design often begins with a needs assessment. The needs assessment helps to shape what the program requires to address the problems it will address. In this post, we will look at how needs assessments are often developed within the context of program evaluation and the various levels of needs that one may encounter.
Process of Needs Assessment
In program evaluation, needs assessment has three phases: preassessment, assessment, and postassessment. Preassessment determines the problem’s current status and the assets available to address it. Some common questions that a preassessment may address are resolving the issue, identifying who is affected by the problem and/or the lack of resources, and determining what has been done in the past to address this situation. The sources of data for this include historical data and interviews.

The assessment phase involves collecting new information on the organization’s needs and assets. Whereas the preassessment looks at the past, the assessment looks at the present situation. The evaluation also addresses the same questions as the preassessment. Since there is so much overlap between the preassessment and the evaluation, it is common to skip this step and move directly to the postassessment.
The postassessment phase involves using the information that was gathered from the first two phases to develop appropriate interventions. For example, if a needs assessment finds a lack of resources for improving reading, an appropriate intervention may be the development of a reading lab. Naturally, the creation of a reading lab would necessitate the need for funding, such as from a grant
Levels of Need
Another aspect of a needs assessment is determining the level of need. In this context, need refers to who is receiving and giving services. A primary-level need is used to identify service recipients. For example, the students who use a reading lab would be at the primary level. Primary-level individuals need the program’s services.
Secondary needs level involves the individual who provides the services of a program. An example of individuals at the secondary need level would be teachers who are supporting the reading lab. Secondary level individuals may need training, support, and or the actual materials to make the program come to life.
Tertiary needs level is the actual support secondary needs level individuals use to make the program happen. As already mentioned, this can include training, materials, and/or support. An example would be training teachers to use the reading lab and making the software readily available for teachers.
Conclusion
A needs assessment is often necessary when developing programs, especially large ones. This crucial step provides clarity about what needs to be developed. With these tools, program administrators can be sure that they are taking a scientific approach to supporting program participants.
There are several different ways to modify continuous data to protect individuals’ privacy. The video below provides several practical ways to do this using Python.

Generating fake data is one way to protect an individual’s privacy. The video below provides examples of how to do this using Python.

In the video below, we will look at how to maintain privacy in data through removing unique combinations and generalizing data.


Program implementation examines how a program is put into practice. The focus of any program is to bring change to whoever the stakeholders of the program are. Therefore, how the program is put into practice or implemented plays a critical role in whether the program is successful.
Components of Implementation
Joseph Durlak describes eight components of program implementation as shown below.
Most of these components are self-explanatory. Fidelity is the level of faithfulness implementors of the program have to the procedures and or protocols of the program. Many programs have an experimental nature in which the participants of the program are compared either to themselves as a “before” group or to a control group that does not experience the program. To confirm that the program is the reason for any difference it must be confirmable that the procedures of the program are adhered to.

The same idea applies to dosage which is the amount of the program that is experienced. This value must be consistent to establish any differences between groups. Dosage can be measured in terms of the amount, length of time, number of occurrences, etc. the program requires.
Adaptions are the modifications that are made to the program for various reasons. Sometimes the original procedures of the program are not practical during implementation. For example, a program may expect participants to receive counseling twice a week for 30 minutes each time for a total of an hour. During implementation, it may be found that the participants were not able to come twice a week. Therefore, instead of meeting twice a week, the program is adapted to meet once a week for one hour. It is critical to keep track of adaptions as they can cause a program to lose its focus and original purpose.
Participant engagement is how involved and cooperative the participants in the program are. Low engagement is often a sign that a program is failing. If this does happen it may be necessary to make adaptations to the program.
Program differentiation is the awareness of how the current program is different from other programs. Knowing what makes a program different is critical in showing how it is superior to other interventions that have been tried. Understanding differences also is an indication for determining what works and does not work in terms of helping participants.
Monitoring of controlled conditions is focused on the controlled variables that need to be monitored when using an experimental and controlled group with programs. Lastly, program reach is a measured of how much of the target population is involved with the program.
It is critical to be aware of these components of implementation as they help evaluators determine the level of success a program has had. It is also important to make sure that the individuals who are actually implementing the program are trained and supported throughout the entire implementation process. If the implementors do not know what to do are feel abandoned then implementation will also suffer.
Factors of Implementation
Components of implementation are aspects of the program that are within the program. Factors of implementation are variables outside of the program that influence it. According to Joseph Durlak, there are also several factors to be aware of when it comes to implementation. Some of the factors include the following
The community level factor relates to traits of the community surrounding the program and can include the policies, politics, and the level of funding for a program. A negative political environment can seriously hamper cooperation for example.
The implementers’ traits can include their skill level, confidence, sense of relevancy, and more. We have already discussed implementors earlier but if the implementors lack the skill even the best programs will fail.
Program traits include how well the program fits with the school and or the adaptability of the program. Sometimes a great program is a poor culture fit and or is too rigid for the local context. An example would be the example used earlier for dosage. Twice-a-week counseling may not be appropriate for the context.
Organizational factors include the climate, openness, integration, etc., of the local organization that is supporting the program. A closed-off organization will probably not support any program no matter the benefits.
Processes include decision-making, communication, planning, etc. Programs require local stakeholders to make decisions about cooperation and other factors related to planning and implementation. If there is a bottleneck or resistance to developing processes the program may never get off the ground.
Staffing is about leadership and how they support the program. Enthusiastic leaders may provide adequate support for a program while indifferent leaders may cause a program to fail. One reason for this is the control over resources and morale that leaders possess.
Professional development has already been alluded to and it is the amount of support and training that implementers of a program need. It is of critical importance that the individuals who bring a program to life through implementation receive the support and training they need in order to ensure success. If the implementors are confused over what to do the program has little hope for success.
Conclusion
Program implementation is often overlooked. People are so excited to begin a new program to help people that they often forget to assess the implementation of it. Doing this can lead to good programs being labeled as failures, leading to finger-pointing. Focusing on the implementation can help to alleviate this common occurrence.
Data privacy and the protection of people’s identities is important. The video below provides some basic ways to ensure the privacy of individuals when working with data.


There are several ways that an individual’s privacy can be protected when dealing with continuous data. In this post, we will look at how protecting privacy can be accomplished using Python.
Libraries
We will begin by loading the necessary libraries. Below is the code.
from pydataset import data
import pandas as pd
The library setup is simple. We are importing the data() function from pydataset. This will allow us to load the data we will use in this post. Below we will address the data preparation. We are also importing pandas to make a frequency table later on.
Data Preparation
The data preparation is also simple. We will load the dataset called “SLID” using the data() function into an object called df. We will then view the df object using the .head() method. Below is the code followed by the output.
df=data('SLID')
df.head()
The data set has five variables. The focus of this post will be on the manipulation of the “age” variable. We will now make a histogram of the data before we manipulate it.
View of Original Histogram
Below is the code output of the histogram of the “age” variable. The reason for making this visual is to provide a “before” picture of the data before changes are made.
df['age'].hist(bins=15)
We will now move to our first transformation which will involve changing the data to a categorical variable.
Change to Categorical
Changing continuous data to categorical is one way of protecting privacy as it removes individual values and replaces them with group values. Below is an example of how to do this with the code and the first few rows of the modified data.
df['age'] = df['age'].apply(lambda x:">=40"if x>=40 else"<40" )
df.head()
We are overwriting the “age” variable in the code using an anonymous function. On the “age” variable we use the .apply() method and replace values above 40 with “>=40” and values below 40 with “<40”. The data is now broken down into two groups, those above 40 and those below 40. Below is a frequency table of the transformed “age” variable.
df['age'].value_counts()age
>=40 3984
<40 3441
Name: count, dtype: int64The .value_counts() method comes from the pandas library. There are two groups now. The table above is a major transformation from the original histogram. Below is the code and output of a bar graph of this transformation
import seaborn as sns
import matplotlib.pyplot as plt
sns.countplot(x="age", data=df)
plt.show()
This was a simple example. You do not have to limit yourself to only two groups to divide your data. How many groups depends on the context and the purpose of the use of this technique.
Top Coding
Top coding is a trick used to bring extremely high values down to a specific value. Again, the purpose of modifying these values in our context is to protect people’s privacy. Below is the code and output for this approach.
df=data('SLID')
df.loc[df['age'] > 75, 'age'] = 75
df['age'].hist(bins=15)
The code does the following.
If you look to the far right you can see that spike in the number of data points at age 75 compared to our original histogram. This is a result of our manipulation of the data. Through doing this, we can keep all of our data for other forms of analysis while also protecting the privacy of the handful of people who are over the age of 75.
Bottom Coding
Bottom coding is the same as top coding except now you raise values below a threshold to a minimum value. Below is the code and output for this.
df=data('SLID')
df.loc[df['age'] < 20, 'age'] = 20
df['age'].hist(bins=15)
The code is the same as before with the only difference being the less than “<” symbol and the threshold being set to 20. As you compare this histogram to the original you can see a huge spike in the number of values at 20.
Conclusion
Data protection is an important aspect of the analysis role. The examples provided here are just some of the many ways in which the privacy of individuals can be respected with the help of Python

The State and Revolution was written by Lenin in 1917. This text provides Lenin’s thoughts on the role of communism in the context of leading the proletarian revolution and the shape of the government afterward. The text is rather repetitive and rambling. Therefore, instead of providing a summary, which would be rather difficult, it was decided to briefly describe some of the text’s main points. These main points are…
None of the ideas above are in one specific place within the text. Instead, they are scattered throughout and shared repeatedly, making the text difficult to understand.
Purpose of the State
Stalin states that the state exists solely because of class antagonism. The government referees the battle between the bourgeoisie and the proletariat in other words. This makes sense as you cannot have property or capital unless there is someone to protect said property. A society without government would not have anything whether communist or capitalist. The capitalists need the government to protect their capital while the proletariat seeks justice from the same government.

Stalin also shares that the ruling class uses the state to oppress the poor. Again, it is hard to refute this as corporate America has teamed up with the government before. However, Lenin has left out how the government has responded to the cries of the poor in the past. For example, during Lenin’s life, the Russian Czar attempted reforms before his downfall. Even before the French Revolution the King of France tried to compromise. As such, even in monarchies tone deafness is difficult to maintain fully.
Purpose of Revolution
Lenin then shared that the purpose of revolution was to overthrow the Bourgeoisie class so the proletarians could take power. Lenin believes that overthrowing the ruling class will solve most if not all of society’s problems.
The problem with this belief is that revolution leads to a new set of oppressors in most cases. The leadership changes but the wicked hearts of man remain the same. Lenin seems to think that the system is the problem (a sentiment shared today). In reality, it is the people who are the problem. All governments have issues and problems, but they also have one thing in common: people who form, lead, and destroy them.
Stages After the Revolution
Lenin also divides the stages after the revolution into three main parts. The first stage is the proletarian dictatorship. This dictatorship involves the proletarians using the apparatus of the conquered state to crush all of the remaining bourgeoise. In other words, the tools of the enemy are used to destroy the enemy. This stage of the revolution has happened in many countries such as Cambodia, Cuba, North Korea, Russia, and Vietnam. The landholders and capitalists are rounded up and killed and the people seize their property. There is often a huge loss of life as the revolutionaries tend to kill indiscriminately in their zeal for change.
The second stage is socialism which involves the government having control over the means of production. Notice how the government is still being used but instead of for slaughtering, the focus has shifted to control of the people. In addition, contrary to popular belief, traditional communism doesn’t want to control all property just property for producing wealth. At this point, everyone only gets what they need instead of what they want, destroying all motivation and ambition to work hard. This is also the stage at which all communist governments stop. The government takes control and they never give up that control. This proves the point that communism swaps one corrupt leadership for another. The main difference between communism and capitalism is who has control, the individual or a monolith government.
The final stage of the revolution is the withering of the state. Once everyone is thoroughly communist and social classes are destroyed there is no need for the state. No communist government has achieved this as the revolution’s leaders enjoy being in charge. The common counter to this observation is that nobody has successfully completed a communist revolution. Therefore, people must try harder to achieve this. It also must be mentioned that there is no view of utopia as Lenin shares that neither he nor Marx knows what that is like. As such, the revolution must continue forever.
Conclusion
This was not a summary of Lenin’s views in his book The State and Revolution. The goal was only to share some of the main points. This is probably one of Lenin’s best-known books and required reading for hardcore leftists. Even though no one has achieved true communism many are highly motivated to make this theory a reality.

Data privacy is a major topic among analysts who want to protect people’s information. There are often ethical expectations that personal identifying information is protected. Whenever data is shared, you want to be sure that individual people cannot be identified within a dataset, which can lead to unforeseen consequences. This post will examine simple ways a data analyst can protect personal information.
Libraries & Data Preparation
There are few libraries and minimal data preparation for this example. The code and output are below.
from pydataset import data
df=data('SLID')
df.head()
The only library we need is “pydataset” which contains the dataset we will use. In the second line, we create an object called “df” which contains our data. The data we are using is called “SLID” and contains data on individuals relating to their wages, education level, age, sex, and language.

We will now move to the first way to protect privacy when working with data.
Drop Columns
Sometimes protecting people’s identity can be as easy as dropping a column. Often, the column(s) that contain the names, addresses, or phone numbers can be dropped. In our example below, we are going to pretend that the “language” column can be used to identify people. Therefore we will drop this column. Below is the code and the output for this.
# Attribute suppression on "language"
suppressed_language = df.drop('language', axis="columns")

# Explore obtained dataset
suppressed_language.head()
To remove the “language” column we use the drop() method. Inside this method, we indicate the name of the column and the axis as well.
Drop Rows
It is also possible to drop rows. Dropping rows may be appropriate for outliers. If only a handful of individuals have a certain value in a column it may be possible to identify them. In the code and output below, we drop all values where education is above or equal to 14.
# Drop rows with education higher than 14
education = df.drop(df[df.education >= 14].index)

# See  DataFrame
education.head()
In the code, we used the drop() method again but subsetted the data to remove rows with education values greater than or equal to 14. We also include the index option to indicate the removal of rows. If you look you can see that several rows are now missing such as 1,3,4,6,8,9 as all of these rows had education scores above 14
Data Masking
Data masking involves removing all or part of the information within a column. In the example below, we remove the values for education and replace them with asterisks.
# Uniformly mask the education column
df['education'] = '****'

# See resulting DataFrame
df.head()
The code involves subsetting the education variable and setting it equal to the asterisks. This approach is similar to dropping the column. However, there may be a reason to keep the column even if there is no useful information in it.
Replace Part of String
Data masking can also include replacing part of the data within a column. In the code below, we will remove some of the information within the “sex” column.
#Modify Sex Column
df['sex'] = df['sex'].apply(lambda text: text[0] + '****' + text[text.find('le'):] )

#See Results
df.head()
The code involves rewriting the data in the “sex” column.
The apply() method allows us to loop through the column like a for loop and repeat this process for every row.
Conclusion
Protecting data is critical when using data. The ideas presented here are just some of the many ways that a data analyst can protect people’s personal information.
The video below explains how to modify the color of glyphs when using Bokeh. Manipulating the color is another way to convey information about your data to the end user.

Modifying the glyphs in a Bokeh data visualization is another useful tool. The video below explains how to do this
