
In this post, we are going to learn how to use the C5.0 algorithm to make a classification tree in order to make predictions about gender based on wage, education, and job experience using a data set in the “Ecdat” package in R. Below is some code to get started.

library(Ecdat); library(C50); library(gmodels)
 data(Wages1)
We now will explore the data to get a sense of what is happening in it. Below is the code for this
str(Wages1)
 ## 'data.frame': 3294 obs. of 4 variables:
 ## $ exper : int 9 12 11 9 8 9 8 10 12 7 ...
 ## $ sex : Factor w/ 2 levels "female","male": 1 1 1 1 1 1 1 1 1 1 ...
 ## $ school: int 13 12 11 14 14 14 12 12 10 12 ...
 ## $ wage : num 6.32 5.48 3.64 4.59 2.42 ...
 hist(Wages1$exper)
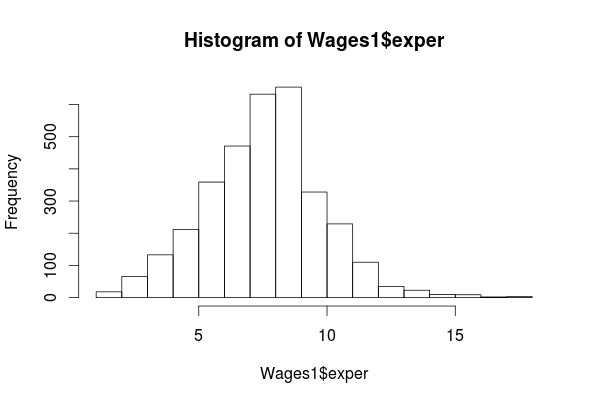
summary(Wages1$exper)
 ## Min. 1st Qu. Median Mean 3rd Qu. Max.
 ## 1.000 7.000 8.000 8.043 9.000 18.000
hist(Wages1$wage)
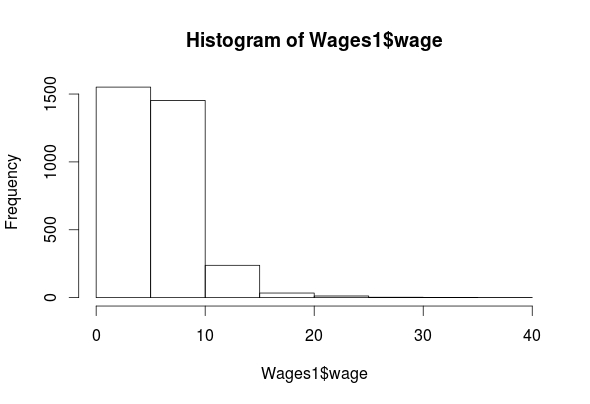
summary(Wages1$wage)
## Min. 1st Qu. Median Mean 3rd Qu. Max.
## 0.07656 3.62200 5.20600 5.75800 7.30500 39.81000
hist(Wages1$school)
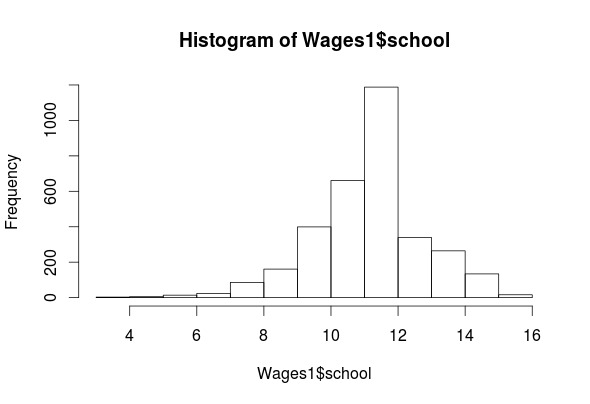
summary(Wages1$school)
 ## Min. 1st Qu. Median Mean 3rd Qu. Max.
 ## 3.00 11.00 12.00 11.63 12.00 16.00
table(Wages1$sex)
## female male
## 1569 1725
As you can see, we have four features (exper, sex, school, wage) in the “Wages1” data set. The histogram for “exper” indicates that it is normally distributed. The “wage” feature is highly left-skewed and almost bimodal. This is not a big deal as classification trees are robust against non-normality. The ‘school’ feature is mostly normally distributed. Lastly, the ‘sex’ feature is categorical but there is almost an equal number of men and women in the data. All of the outputs for the means are listed above.
Create Training and Testing Sets
We now need to create our training and testing data sets. In order to do this, we need to first randomly reorder our data set. For example, if the data is sorted by one of the features, to split it now would lead to extreme values all being lumped together in one data set.
To make things more confusing, we also need to set our seed. This allows us to be able to replicate our results. Below is the code for doing this.
set.seed(12345)
 Wage_rand<-Wages1[order(runif(3294)),]
What we did is explained as follows
- set the seed using the ‘set.seed’ function (We randomly picked the number 12345)
- We created the variable ‘Wage_rand’ and we assigned the following
- From the ‘Wages1’ dataset we used the ‘runif’ function to create a list of 3294 numbers (1-3294) we did this because there are a total of 3294 examples in the dataset.
- After generating the 3294 numbers we then order sequentially using the “order” function.
- We then assigned each example in the “Wages1” dataset one of the numbers we created
We will now create are training and testing set using the code below.
Wage_train<-Wage_rand[1:2294,]
 Wage_test<-Wage_rand[2295:3294,]
Make the Model
We can now begin training a model below is the code.
Wage_model<-C5.0(Wage_train[-2], Wage_train$sex)
The coding for making the model should be familiar by now. One thing that is new is the brackets with the -2 inside. This tells r to ignore the second column in the dataset. We are doing this because we want to predict sex. If it is a part of the independent variables we cannot predict it. We can now examine the results of our model by using the following code.
Wage_model
##
## Call:
## C5.0.default(x = Wage_train[-2], y = Wage_train$sex)
##
## Classification Tree
## Number of samples: 2294
## Number of predictors: 3
##
## Tree size: 9
##
## Non-standard options: attempt to group attributes
summary(Wage_model)
##
## Call:
## C5.0.default(x = Wage_train[-2], y = Wage_train$sex)
##
##
## C5.0 [Release 2.07 GPL Edition] Wed May 25 10:55:22 2016
## ——————————-
##
## Class specified by attribute `outcome’
##
## Read 2294 cases (4 attributes) from undefined.data
##
## Decision tree:
##
## wage <= 3.985179: ## :…school > 11: female (345/109)
## : school <= 11:
## : :…exper <= 8: female (224/96) ## : exper > 8: male (143/59)
## wage > 3.985179:
## :…wage > 9.478313: male (254/61)
## wage <= 9.478313: ## :…school > 12: female (320/132)
## school <= 12:
## :…school <= 10: male (246/70) ## school > 10:
## :…school <= 11: male (265/114) ## school > 11:
## :…exper <= 6: female (83/35) ## exper > 6: male (414/173)
##
##
## Evaluation on training data (2294 cases):
##
## Decision Tree
## —————-
## Size Errors
##
## 9 849(37.0%) <<
##
##
## (a) (b) ## —- —-
## 600 477 (a): class female
## 372 845 (b): class male
##
##
## Attribute usage:
##
## 100.00% wage
## 88.93% school
## 37.66% exper
##
##
## Time: 0.0 secs
The “Wage_model” indicates a small decision tree of only 9 decisions. The “summary” function shows the actual decision tree. It’s somewhat complicated but I will explain the beginning part of the tree.
If wages are less than or equal to 3.98 then the person is female THEN
If the school is greater than 11 then the person is female ELSE
If the school is less than or equal to 11 THEN
If The experience of the person is less than or equal to 8 the person is female ELSE
If the experience is greater than 8 the person is male etc.
The next part of the output shows the amount of error. This model misclassified 37% of the examples which is pretty high. 477 men were misclassified as women and 372 women were misclassified as men.
Predict with the Model
We will now see how well this model predicts gender in the testing set. Below is the code
Wage_pred<-predict(Wage_model, Wage_test)

CrossTable(Wage_test$sex, Wage_pred, prop.c = FALSE,
 prop.r = FALSE, dnn=c('actual sex', 'predicted sex'))
The output will not display properly here. Please see C50 for a pdf of this post and go to page 7
Again, this code should be mostly familiar for the prediction model. For the table, we are comparing the test set sex with predicted sex. The overall model was correct 269 + 346/1000 for 61.5% accuracy rate, which is pretty bad.
Improve the Model
There are two ways we are going to try and improve our model. The first is adaptive boosting and the second is error cost.
Adaptive boosting involves making several models that “vote” how to classify an example. To do this you need to add the ‘trials’ parameter to the code. The ‘trial’ parameter sets the upper limit of the number of models R will iterate if necessary. Below is the code for this and the code for the results.
Wage_boost10<-C5.0(Wage_train[-2], Wage_train$sex, trials = 10)
 #view boosted model
 summary(Wage_boost10)
 ##
 ## Call:
 ## C5.0.default(x = Wage_train[-2], y = Wage_train$sex, trials = 10)
 ##
 ##
 ## C5.0 [Release 2.07 GPL Edition] Wed May 25 10:55:22 2016
 ## -------------------------------
 ##
 ## Class specified by attribute `outcome'
 ##
 ## Read 2294 cases (4 attributes) from undefined.data
 ##
 ## ----- Trial 0: -----
 ##
 ## Decision tree:
 ##
 ## wage <= 3.985179: ## :...school > 11: female (345/109)
 ## : school <= 11:
 ## : :...exper <= 8: female (224/96) ## : exper > 8: male (143/59)
 ## wage > 3.985179:
 ## :...wage > 9.478313: male (254/61)
 ## wage <= 9.478313: ## :...school > 12: female (320/132)
 ## school <= 12:
 ## :...school <= 10: male (246/70) ## school > 10:
 ## :...school <= 11: male (265/114) ## school > 11:
 ## :...exper <= 6: female (83/35) ## exper > 6: male (414/173)
 ##
 ## ----- Trial 1: -----
 ##
 ## Decision tree:
 ##
 ## wage > 6.848846: male (663.6/245)
 ## wage <= 6.848846:
 ## :...school <= 10: male (413.9/175) ## school > 10: female (1216.5/537.6)
 ##
 ## ----- Trial 2: -----
 ##
 ## Decision tree:
 ##
 ## wage <= 3.234474: female (458.1/192.9) ## wage > 3.234474: male (1835.9/826.2)
 ##
 ## ----- Trial 3: -----
 ##
 ## Decision tree:
 ##
 ## wage > 9.478313: male (234.8/82.1)
 ## wage <= 9.478313:
 ## :...school <= 11: male (883.2/417.8) ## school > 11: female (1175.9/545.1)
 ##
 ## ----- Trial 4: -----
 ##
 ## Decision tree:
 ## male (2294/1128.1)
 ##
 ## *** boosting reduced to 4 trials since last classifier is very inaccurate
 ##
 ##
 ## Evaluation on training data (2294 cases):
 ##
 ## Trial Decision Tree
 ## ----- ----------------
 ## Size Errors
 ##
 ## 0 9 849(37.0%)
 ## 1 3 917(40.0%)
 ## 2 2 958(41.8%)
 ## 3 3 949(41.4%)
 ## boost 864(37.7%) <<
 ##
 ##
 ## (a) (b) ## ---- ----
 ## 507 570 (a): class female
 ## 294 923 (b): class male
 ##
 ##
 ## Attribute usage:
 ##
 ## 100.00% wage
 ## 88.93% school
 ## 37.66% exper
 ##
 ##
 ## Time: 0.0 secs
R only created 4 models as there was no additional improvement after this. You can see each model in the printout. The overall results are similar to our original model that was not boosted. We will now see how well our boosted model predicts with the code below.
Wage_boost_pred10<-predict(Wage_boost10, Wage_test)
 CrossTable(Wage_test$sex, Wage_boost_pred10, prop.c = FALSE,
 prop.r = FALSE, dnn=c('actual Sex Boost', 'predicted Sex Boost'))
Our boosted model has an accuracy rate 223+379/1000 = 60.2% which is about 1% better then our unboosted model (59.1%). As such, boosting the model was not useful (see page 11 of the pdf for the table printout.)
Our next effort will be through the use of a cost matrix. A cost matrix allows you to impose a penalty on false positives and negatives at your discretion. This is useful if certain mistakes are too costly for the learner to make. IN our example, we are going to make it 4 times more costly misclassify a female as a male (false negative) and 1 times for costly to misclassify a male as a female (false positive). Below is the code
error_cost Wage_cost<-C5.0(Wage_train[-21], Wage_train$sex, cost = error_cost)
 Wage_cost_pred<-predict(Wage_cost, Wage_test)
 CrossTable(Wage_test$sex, Wage_cost_pred, prop.c = FALSE,
 prop.r = FALSE, dnn=c('actual Sex EC', 'predicted Sex EC'))
With this small change our model is 100% accurate (see page 12 of the pdf).
Conclusion
This post provided an example of decision trees. Such a model allows someone to predict a given outcome when given specific information.
Pingback: educationalresearchtechniques | Education and R...
Pingback: Using Probability of the Prediction to Evaluate a Machine Learning Model | educational research techniques
Pingback: K-Fold Cross-Validation | educational research techniques
Pingback: Developing an Automatically Tuned Model in R | educational research techniques
Pingback: Developing a Customize Tuning Process in R | educational research techniques
Pingback: Using Probability of the Prediction to Evaluate a Machine Learning Model | educational research techniques