In the video below, we will look at how to perform various column-wise computations with data tables in R.


In the video below, we will look at how to perform various column-wise computations with data tables in R.
Data tables provide an efficient way to work with and manipulate data. In the video below, examples are provided of the strengths and benefits of using data tables.

Annotations add text and other objects to a visualization to provide information. The video below explains how to add annotations to a visualization when using Python.

In this post, we will look at some common characteristics of Communism. Naturally, this is not an exhaustive list; however, it does provide a basic introduction to these commonly held traits.
Restrictions on Property
One of the most common tenets of Communism is restrictions on property. Commonly, this has been interpreted as no private property. Several attempts at Communism have removed all private property rights, such as in the Soviet Union. Marx did dislike private property, but he truly hated individual ownership of the means of production. Anything that could produce wealth should be owned by the people, in Marx’s opinion.
Therefore, and much to many people’s surprise, Marx may not have had issues with people owning homes, computers, phones, or cars, but he would challenge a person’s right to own farmland, factories, or businesses. Consumption was fine as long as production was controlled centrally.
Loss of Individualism
Many interpretations of Communism involve the sacrifice of the individual for the collective. Individualism is often seen as a threat because, to have a communist society, everyone must go along with it. In other words, for true Communism to arise, everyone must support it so that the state withers away. Particularly for Communists who ascribe and yearn for a utopia, this heaven on earth cannot transpire until dissent is removed.

This desire for a man-made, secular heaven explains in part the tremendous amount of persecution and death that is associated with Communism. Unlike capitalism, which may abuse power to make more money, Communism will abuse power to bring about a new earth in which there is no more strife. In other words, the sacrifice of the few to save the many.
Examples of the destruction of countless lives in the pursuit of Communism can be found in the millions who died in the Soviet Union, China, and Cambodia. Dissenters and even apparent dissenters were systematically destroyed or “reeducated.” All this was done in the name of the people to bring about a better world.
Upheaval of Social Order
Communism brings about a total upheaval of the social order. Marx makes it clear that the working class, or proletariat, needs to rise and overthrow the bourgeoisie. Later, Communist thinkers such as Marcuse included minorities (whether sexual, racial, gender, etc.) as part of the revolution. Eventually, everyone is included as oppressed, thanks to the splintering of people into oppressed groups that encompass anyone who is not part of the normalized society.
The destruction of the current oppressors creates a vacuum that the rising Communist leaders fill. Essentially, Communism throws out one corrupt government to bring in another. The new leaders claim to be for the people, but eventually become accustomed to doing whatever it takes to maintain their power. An example would be what has happened in Cuba, China, and North Korea over the past 80 years. Each of these governments used Communism to take power and has used it to maintain power.
Religious Undertones
Even though Marx despised religion, Communism is often treated as a religion. Some adherents of Communism truly believe that implementing this belief system will lead to peace and prosperity on Earth in a way that believers in Christianity believe in heaven.
Even with all the evidence to the contrary that Communism does not work, believers fight to preserve the idea of Communism. A common counterargument is that Communism has never been implemented properly or that the famous leaders of Communism misunderstood it.
For example, the focus of Communism was primarily economic, with an emphasis on the means of production. However, as the middle class rose and became content, many communist thought leaders moved from attacking the means of production to critiquing the cultural reproduction of society. This is why there is so much criticism of Judeo-Christian-Heterosexual-White norms in the West today. Pulling down these norms today is the equivalent of seizing the factories of the bourgeoisie in the 19th century.
Communism seeks to displace other religious systems to generate a religion in which man is God rather than the gods of various religions. Marx viewed religion as a tool that kept people asleep and ignorant of their condition. This has been interpreted as the need to destroy religion by many so that the masses are awakened or “woke.” Evangelism is performed with protesting in the streets and or the barrel of a gun rather than with the persuasion of the Bible.
Conclusion
Communism is a complex ideology that has had a major influence on the world. For better or for worse, people believe that the ideas of Communism will make the world a better place. As such, there have been attempts to realize the ideas of the philosophy with mixed results. Despite the implementation, the traits described here are generally present when Communists take power.

In this post, we will go over more examples of how to manipulate data with data.table in R. We will begin by loading the needed packages and preparing our data.
Packages and Data Preparation
In the code below, we load our library data.table. Next, we prepare our data set mtcars and convert it into a data.table of the same name. Note that mtcars is preloaded within R.
library(data.table)
mtcars<-data.table(mtcars)
Below is a preview of the mtcars dataset.
> head(mtcars)
     mpg   cyl  disp    hp  drat    wt  qsec    vs    am  gear  carb
   <num> <num> <num> <num> <num> <num> <num> <num> <num> <num> <num>
1:  21.0     6   160   110  3.90 2.620 16.46     0     1     4     4
2:  21.0     6   160   110  3.90 2.875 17.02     0     1     4     4
3:  22.8     4   108    93  3.85 2.320 18.61     1     1     4     1
4:  21.4     6   258   110  3.08 3.215 19.44     1     0     3     1
5:  18.7     8   360   175  3.15 3.440 17.02     0     0     3     2
6:  18.1     6   225   105  2.76 3.460 20.22     1     0     3     1
Selecting Columns
Below is an example of how to select columns. You can do this by using brackets and placing the columns you want inside the c function. Remember to place a comma in front of the c function, as this indicates to take all rows of data, while the information after the comma indicates which columns to take.
# Select mpg and cyl using a character vector
> mtcars_select <- mtcars[,c("mpg","cyl")]
> head(mtcars_select)
   mpg cyl
1 21.0   6
2 21.0   6
3 22.8   4
4 21.4   6
5 18.7   8
6 18.1   6
By indicating which columns we wanted, we were able to pull only what we wanted. If you want to leave out columns, you just need to place a minus sign in front of the c function as shown below.
> # Deselect mph and cyl columns
> mtcars_drop <- mtcars[,-c("mpg","cyl")]
> head(mtcars_drop)
    disp    hp  drat    wt  qsec    vs    am  gear  carb
   <num> <num> <num> <num> <num> <num> <num> <num> <num>
1:   160   110  3.90 2.620 16.46     0     1     4     4
2:   160   110  3.90 2.875 17.02     0     1     4     4
3:   108    93  3.85 2.320 18.61     1     1     4     1
4:   258   110  3.08 3.215 19.44     1     0     3     1
5:   360   175  3.15 3.440 17.02     0     0     3     2
6:   225   105  2.76 3.460 20.22     1     0     3     1
In the example above, the columns left out are mpg and cyl, as we indicated. Next, we will look at performing calculations.
Performing Calculations
It is also possible to perform specific calculations. In the example below, we calculate the median mpg of all cars in the dataset.
> # Calculate median mpg using the j argument
> median_mpg <- mtcars[,median(mpg)]
> median_mpg
[1] 19.2
As you can see, to perform a calculation, you must place the function inside the brackets and after the comma. The column you want to perform the calculation on must be inside the formula, as usual.
It is also possible to give names to your output. In the example below, we provide the output of our calculation, the name “mean_mpg”. Notice also the use of the period right in front of the parentheses, which is needed when performing this type of calculation
> # Calculate the average mpg as mean_mpg
> mean_mpg <- mtcars[,.(mean_mpg=mean(mpg))]
> mean_mpg
   mean_mpg
       <num>
1:  20.09062
In our example above, we can see that the average mpg of all the cars in our dataset is 20.09.
Multiple Calculations
By employing the same dot notation, it is possible to perform multiple calculations at once. In the example below, we find the minimum and maximum values of mpg for all cars.
> # Get the min and max mpg values
> min_max_mpg <- mtcars[, .(min(mpg),max(mpg))]
> min_max_mpg
      V1    V2
   <num> <num>
1:  10.4  33.9
There is nothing unique here except for the inclusion of a second function. Notice how each function is separated by a comma.
Just as before, you can also name each output from your results. Below is the mean weight and the max hp from the dataset.
> # Calculate the average wt and the max hp
> other_stats <- mtcars[, .(mean_wt=mean(wt),max_hp=max(hp))]
> other_stats
   mean_wt max_hp
     <num>  <num>
1: 3.21725    335
Filtering and Calculations
So far, we have not made any adjustments to the input before the comma when performing calculations. In the example below, we are filtering for cars with 6 cylinders and hp that is less than 120. Once this is filtered, we then want to calculate the minimum and maximum mpg.
> #filter for two or more variables then statistics
> mpg_stats <- mtcars[cyl==6 & hp<120, .(min_dur=min(mpg),
+                             max_dur=max(mpg))]
> mpg_stats
   min_dur max_dur
     <num>   <num>
1:    18.1    21.4
The output speaks for itself. Normally, when subsetting data, the information before the comma indicates the rows. However, when performing calculations, the information before the comma can be used to filter the data as appropriate.
In the example below, we make a histogram based on the same filtering criteria.
mtcars[cyl==6 & hp<120,
                    hist(mpg)]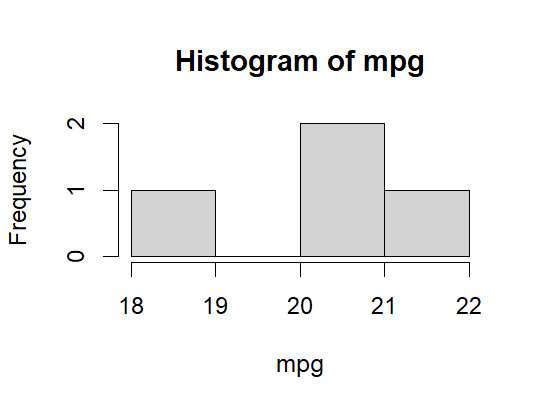
As you can see, the use of data.table is almost endless
Conclusion
The data.table library provides you with several beneficial tools for conveniently slicing data. Data analysis can use these tools as needed to provide insights for their audience.