


In this post, we will go over more examples of how to manipulate data with data.table in R. We will begin by loading the needed packages and preparing our data.
Packages and Data Preparation
In the code below, we load our library data.table. Next, we prepare our data set mtcars and convert it into a data.table of the same name. Note that mtcars is preloaded within R.
library(data.table)
mtcars<-data.table(mtcars)
Below is a preview of the mtcars dataset.
> head(mtcars)
     mpg   cyl  disp    hp  drat    wt  qsec    vs    am  gear  carb
   <num> <num> <num> <num> <num> <num> <num> <num> <num> <num> <num>
1:  21.0     6   160   110  3.90 2.620 16.46     0     1     4     4
2:  21.0     6   160   110  3.90 2.875 17.02     0     1     4     4
3:  22.8     4   108    93  3.85 2.320 18.61     1     1     4     1
4:  21.4     6   258   110  3.08 3.215 19.44     1     0     3     1
5:  18.7     8   360   175  3.15 3.440 17.02     0     0     3     2
6:  18.1     6   225   105  2.76 3.460 20.22     1     0     3     1
Selecting Columns
Below is an example of how to select columns. You can do this by using brackets and placing the columns you want inside the c function. Remember to place a comma in front of the c function, as this indicates to take all rows of data, while the information after the comma indicates which columns to take.
# Select mpg and cyl using a character vector
> mtcars_select <- mtcars[,c("mpg","cyl")]
> head(mtcars_select)
   mpg cyl
1 21.0   6
2 21.0   6
3 22.8   4
4 21.4   6
5 18.7   8
6 18.1   6
By indicating which columns we wanted, we were able to pull only what we wanted. If you want to leave out columns, you just need to place a minus sign in front of the c function as shown below.
> # Deselect mph and cyl columns
> mtcars_drop <- mtcars[,-c("mpg","cyl")]
> head(mtcars_drop)
    disp    hp  drat    wt  qsec    vs    am  gear  carb
   <num> <num> <num> <num> <num> <num> <num> <num> <num>
1:   160   110  3.90 2.620 16.46     0     1     4     4
2:   160   110  3.90 2.875 17.02     0     1     4     4
3:   108    93  3.85 2.320 18.61     1     1     4     1
4:   258   110  3.08 3.215 19.44     1     0     3     1
5:   360   175  3.15 3.440 17.02     0     0     3     2
6:   225   105  2.76 3.460 20.22     1     0     3     1
In the example above, the columns left out are mpg and cyl, as we indicated. Next, we will look at performing calculations.
Performing Calculations
It is also possible to perform specific calculations. In the example below, we calculate the median mpg of all cars in the dataset.
> # Calculate median mpg using the j argument
> median_mpg <- mtcars[,median(mpg)]
> median_mpg
[1] 19.2
As you can see, to perform a calculation, you must place the function inside the brackets and after the comma. The column you want to perform the calculation on must be inside the formula, as usual.
It is also possible to give names to your output. In the example below, we provide the output of our calculation, the name “mean_mpg”. Notice also the use of the period right in front of the parentheses, which is needed when performing this type of calculation
> # Calculate the average mpg as mean_mpg
> mean_mpg <- mtcars[,.(mean_mpg=mean(mpg))]
> mean_mpg
   mean_mpg
       <num>
1:  20.09062
In our example above, we can see that the average mpg of all the cars in our dataset is 20.09.
Multiple Calculations
By employing the same dot notation, it is possible to perform multiple calculations at once. In the example below, we find the minimum and maximum values of mpg for all cars.
> # Get the min and max mpg values
> min_max_mpg <- mtcars[, .(min(mpg),max(mpg))]
> min_max_mpg
      V1    V2
   <num> <num>
1:  10.4  33.9
There is nothing unique here except for the inclusion of a second function. Notice how each function is separated by a comma.
Just as before, you can also name each output from your results. Below is the mean weight and the max hp from the dataset.
> # Calculate the average wt and the max hp
> other_stats <- mtcars[, .(mean_wt=mean(wt),max_hp=max(hp))]
> other_stats
   mean_wt max_hp
     <num>  <num>
1: 3.21725    335
Filtering and Calculations
So far, we have not made any adjustments to the input before the comma when performing calculations. In the example below, we are filtering for cars with 6 cylinders and hp that is less than 120. Once this is filtered, we then want to calculate the minimum and maximum mpg.
> #filter for two or more variables then statistics
> mpg_stats <- mtcars[cyl==6 & hp<120, .(min_dur=min(mpg),
+                             max_dur=max(mpg))]
> mpg_stats
   min_dur max_dur
     <num>   <num>
1:    18.1    21.4
The output speaks for itself. Normally, when subsetting data, the information before the comma indicates the rows. However, when performing calculations, the information before the comma can be used to filter the data as appropriate.
In the example below, we make a histogram based on the same filtering criteria.
mtcars[cyl==6 & hp<120,
                    hist(mpg)]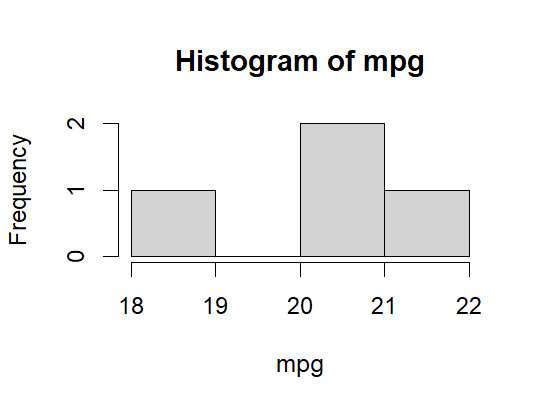
As you can see, the use of data.table is almost endless
Conclusion
The data.table library provides you with several beneficial tools for conveniently slicing data. Data analysis can use these tools as needed to provide insights for their audience.